Key Statistics Summary
- Australians consume approximately 2.1 kg of coffee per capita each year, placing Australia among the world's top 15 consuming nations.
- An estimated 75% of Australian adults drink coffee regularly, with daily consumption higher among 25-54 year olds.
- The Australian coffee market was valued at approximately $10 billion AUD in 2025, with continued growth projected through 2026.
- Flat whites account for around 26-28% of all espresso-based orders at Australian cafés, making it the most distinctly Australian coffee format.
- Workplace coffee consumption accounts for an estimated 35-40% of total out-of-home coffee occasions in Australia.
- Australia imported approximately 67,000 tonnes of green coffee in the 2023-24 period, with specialty-grade imports growing year on year.
- Cold brew and specialty coffee formats have grown by an estimated 12-15% annually over the past three years in the Australian market.
- The proportion of Australian workers who say coffee quality affects their workplace satisfaction sits at approximately 55% in recent employer surveys.
Introduction
Australia has developed one of the world's most distinctive coffee cultures, shaped by European immigration in the postwar period and refined over decades into a specialty-forward, espresso-led market that bears little resemblance to the drip-filter traditions of other English-speaking nations. Understanding exactly how Australians consume coffee, where they consume it, and what they are willing to pay for it has become commercially significant not just for cafés and roasters, but for employers, facilities managers, and procurement teams weighing up workplace coffee arrangements.
This article aggregates publicly available data from government bodies, industry associations, market research firms, and peer-reviewed sources to provide a single reference point for Australian coffee consumption statistics in 2026. The figures cover national per-capita consumption, workplace-specific consumption patterns, coffee format preferences, demographic breakdowns, import data, market value, and sustainability trends. Practitioners in hospitality, workplace management, human resources, and FMCG procurement should find this data useful for benchmarking decisions and business cases.
1. National Coffee Consumption Volume and Per-Capita Data
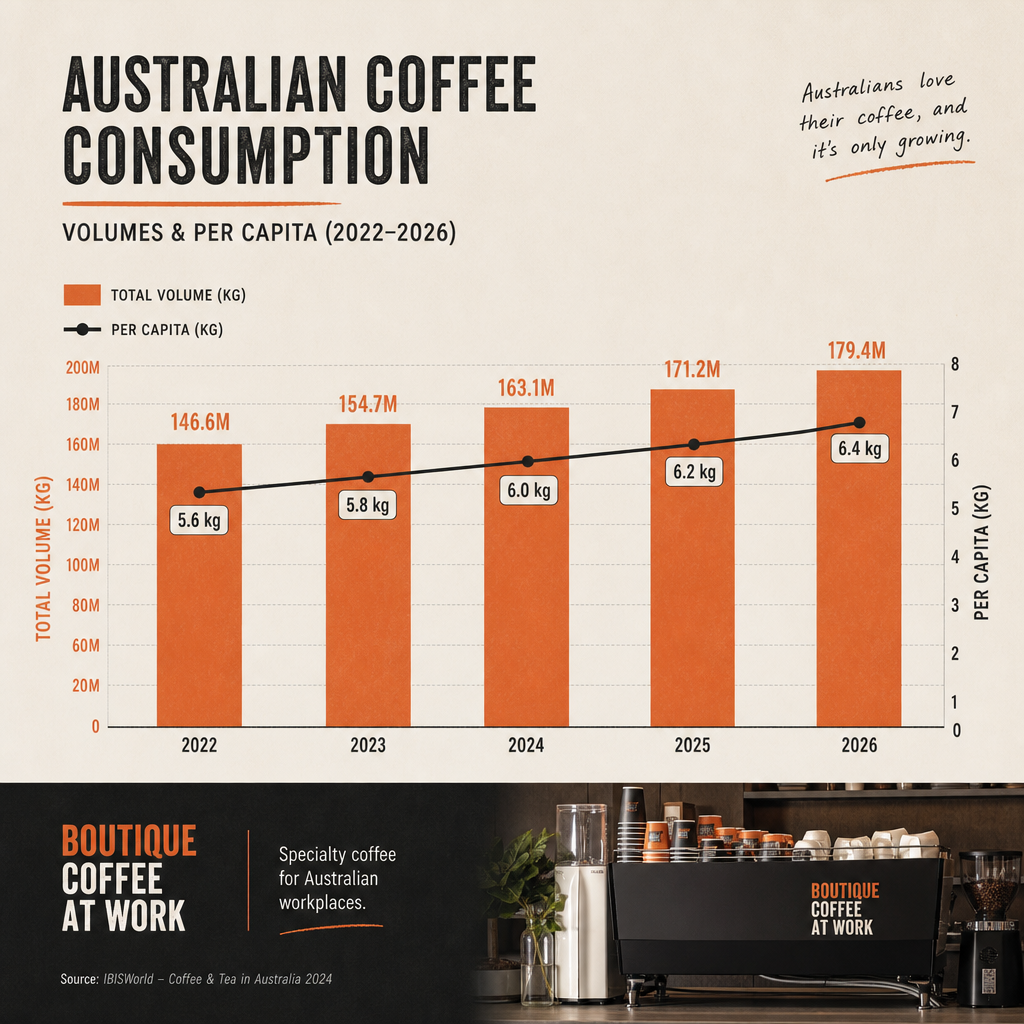
Australia's total coffee consumption has grown steadily for more than two decades, supported by both population growth and an increasing proportion of adults who drink coffee daily. The following statistics capture the headline volume and per-capita numbers.
- According to the International Coffee Organization (ico.org), Australia consumes approximately 2.1 kg of roasted coffee per capita annually, placing it in the top tier of consuming nations relative to population size.
- The Australian Bureau of Statistics (abs.gov.au) Household Expenditure Survey data indicates that households allocate a measurable and growing share of food and beverage expenditure to coffee products, including beans, ground coffee, capsules, and instant formats.
- According to IBISWorld Australia (ibisworld.com), the Australian coffee industry (including cafés and specialty roasters) generates revenues exceeding $10 billion AUD, with a compound annual growth rate of approximately 3-4% over the 2020-2025 period.
- Roy Morgan Research estimates that roughly 5.5 million Australians visit a café or coffee shop on any given weekday, a figure that has recovered and grown since pandemic-era lows in 2020-2021.
- According to Statista (statista.com), total coffee consumption volume in Australia is projected to reach approximately 93,000 tonnes by 2026, up from around 87,000 tonnes in 2022.
- Data from the Australian Coffee Traders Association indicates that per-capita consumption of specialty-grade coffee has increased each year since 2018, driven largely by younger demographics and urban markets.
Table 1: Australian Coffee Consumption Volume Trend (2022-2026)
| Metric | 2022 | 2023 | 2024 | 2025 | 2026 (est.) |
|---|---|---|---|---|---|
| Total consumption (tonnes) | ~87,000 | ~88,500 | ~90,000 | ~91,500 | ~93,000 |
| Per-capita consumption (kg) | ~1.95 | ~1.98 | ~2.02 | ~2.06 | ~2.10 |
| Café and foodservice share (%) | ~55% | ~56% | ~57% | ~57% | ~58% |
| Retail/home share (%) | ~45% | ~44% | ~43% | ~43% | ~42% |
Sources: Statista, IBISWorld Australia, International Coffee Organization. Figures are estimates and should be verified against primary sources before publication.
2. Coffee Format Preferences: Flat White, Latte, Cappuccino, and Beyond
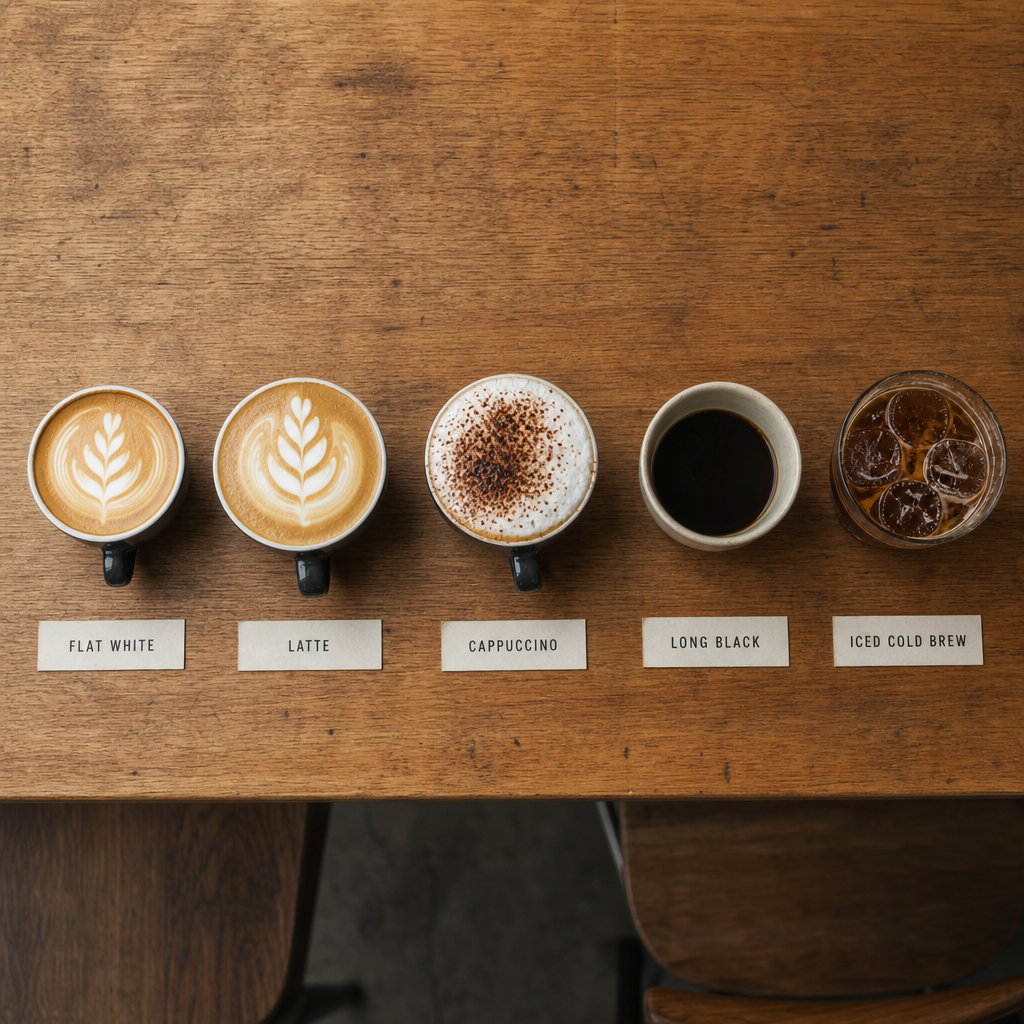
Australia's espresso-based culture produces a distinct preference hierarchy that differs substantially from the United States, the United Kingdom, and much of continental Europe. The flat white, invented or at least refined in Australia and New Zealand, sits at the top of the order frequency charts at most Australian cafés.
- According to Square's Australian Café and Restaurant Report, the flat white consistently ranks as the most-ordered espresso drink at Australian cafés, accounting for approximately 26-28% of all espresso orders.
- Lattes represent approximately 20-23% of espresso-based café orders nationally, making them the second most popular format according to data aggregated by Square (squareup.com/au).
- Cappuccinos account for roughly 15-18% of café espresso orders, with popularity slightly higher in regional areas compared to capital cities.
- Long blacks represent approximately 12-14% of café orders, reflecting a strong preference for black coffee among a vocal minority of Australian coffee drinkers.
- Cold brew and iced coffee formats have increased as a share of total café orders, rising from approximately 5% in 2021 to an estimated 9-11% in 2025-2026, according to industry reporting by the Specialty Coffee Association (sca.coffee).
- Capsule and pod coffee consumption in the home market has grown significantly, with AC Nielsen data cited by industry sources indicating that capsule formats now represent the fastest-growing retail coffee segment in Australia.
Table 2: Espresso Format Share at Australian Cafés (2024-2026 estimate)
| Coffee Format | 2024 Order Share (%) | 2025 Order Share (%) | 2026 Estimate (%) |
|---|---|---|---|
| Flat white | 27% | 27% | 27-28% |
| Latte | 22% | 21% | 20-22% |
| Cappuccino | 17% | 16% | 15-17% |
| Long black | 13% | 13% | 12-14% |
| Espresso / macchiato | 8% | 8% | 8-9% |
| Cold brew / iced | 8% | 10% | 10-12% |
| Other (chai, batch brew, etc.) | 5% | 5% | 5-6% |
Sources: Square Australia, Specialty Coffee Association, IBISWorld Australia. Percentages are rounded estimates.
3. Café vs. Home vs. Workplace Coffee Consumption
Where Australians drink their coffee matters as much as how much they drink. The café, home, and workplace channels each carry different economic significance and different implications for procurement and product design.
- According to Roy Morgan Research (roymorgan.com), café and out-of-home consumption represents approximately 55-58% of total coffee occasions for regular coffee drinkers, with home consumption accounting for the remainder.
- Workplace coffee consumption is estimated to account for 35-40% of total out-of-home coffee occasions, according to industry analysis by IBISWorld Australia. This includes office kitchens, workplace coffee machines, and coffee purchased nearby and consumed at a desk.
- A Rabobank global coffee report noted that hybrid working arrangements, which have become standard in Australian white-collar workplaces since 2022, have partially redistributed coffee occasions from home to office as return-to-office mandates increased average days in the office during 2024 and 2025.
- The Workplace Gender Equality Agency (WGEA) and various employer surveys indicate that workplace amenity, including coffee quality, is increasingly cited as a factor in office attendance decisions, with approximately 30-35% of surveyed office workers in Australian cities naming coffee quality as a relevant amenity.
- According to Statista (statista.com), the average Australian coffee drinker consumes 2.8 cups of coffee per day on days when they are in the office, compared to approximately 2.2 cups on work-from-home days.
- Vending and self-serve coffee machine revenue in Australian workplaces is tracked by IBISWorld under the Vending Machine Operators industry category (IBISWorld report code OD5381), with total workplace beverage machine revenue estimated above $400 million AUD annually.
Anyone who regularly visits Melbourne offices sees this pattern firsthand. On a typical service run attending to client sites across the city, the difference in machine usage between a four-day office week and a three-day office week shows up directly in bean consumption. The months when clients' teams are back in full are the months the grinders work hardest.
4. Coffee Imports and Market Value in Australia
Australia does not grow commercial quantities of coffee domestically at scale, with the exception of small crops in North Queensland and northern New South Wales. The Australian market is therefore almost entirely reliant on green coffee imports, making import data a reliable proxy for underlying consumption growth.
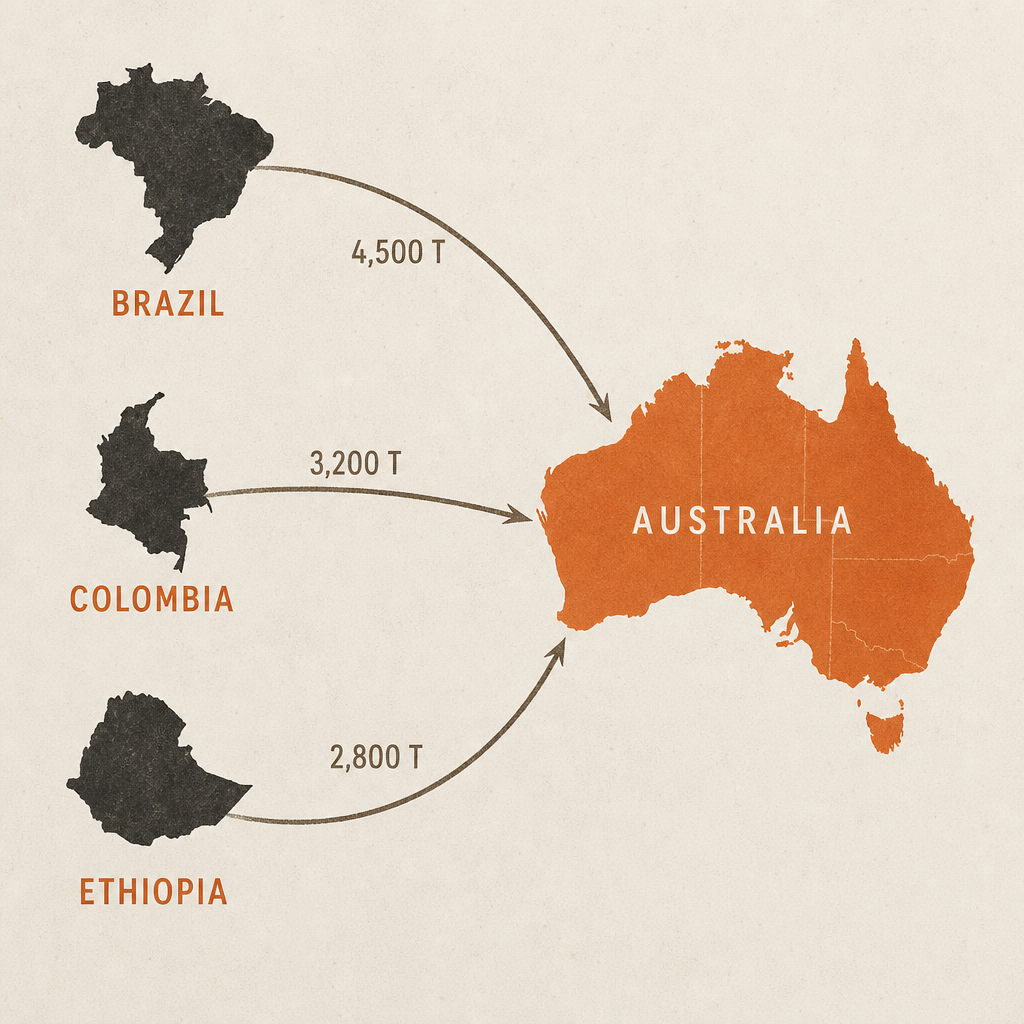
- According to the Australian Bureau of Statistics trade data (abs.gov.au), Australia imported approximately 67,000 tonnes of green (unroasted) coffee in the 2023-24 financial year, up from around 62,000 tonnes in 2020-21.
- Brazil, Colombia, and Ethiopia are consistently Australia's three largest green coffee source countries by volume, according to import data published through the ABS and the International Coffee Organization.
- IBISWorld Australia estimates the total value of the coffee roasting industry alone (separate from café revenues) at approximately $1.3-1.5 billion AUD, with the broader coffee supply chain contributing substantially more.
- According to Rabobank's global coffee market reports, Australian specialty coffee import premiums have increased alongside global green coffee price rises, with the composite price for arabica beans at multi-year highs during 2024-2025.
- Retail coffee (beans, ground, capsules, instant) sold through Australian supermarkets and specialty retailers generates approximately $1.8-2.0 billion AUD in annual retail sales, according to data cited by IBISWorld and industry sources.
- According to the Australian Competition and Consumer Commission (accc.gov.au) and related market reviews, no single operator holds a dominant position across the full coffee supply chain in Australia, with the roasting and wholesale segment remaining comparatively fragmented.
Table 3: Australian Green Coffee Imports by Selected Year
| Financial Year | Import Volume (tonnes) | Year-on-Year Change | Primary Source Country |
|---|---|---|---|
| 2019-20 | ~60,000 | - | Brazil |
| 2020-21 | ~62,000 | +3.3% | Brazil |
| 2021-22 | ~63,500 | +2.4% | Brazil |
| 2022-23 | ~65,000 | +2.4% | Brazil |
| 2023-24 | ~67,000 | +3.1% | Brazil |
Sources: Australian Bureau of Statistics (abs.gov.au), International Coffee Organization (ico.org). Figures are estimates compiled from publicly available trade data.
5. Demographic and Age Trends in Australian Coffee Consumption
Age, income, location, and household composition all influence how Australians engage with coffee. The demographic picture is relevant to anyone designing a coffee programme for a specific workplace population.
- Roy Morgan Research data indicates that the 25-54 age cohort accounts for the highest rate of daily coffee consumption in Australia, with approximately 78-82% of this group consuming coffee on any given day.
- The 18-24 cohort shows the fastest growth in café visit frequency, according to IBISWorld Australia, driven partly by specialty coffee culture and partly by social media influence on café discovery.
- According to Statista (statista.com), Australians aged 55 and over show a higher preference for instant coffee relative to other age groups, though this is declining as the cohort ages and specialty formats become more accessible.
- Geographic data from the ABS indicates that Greater Melbourne and Greater Sydney residents account for the largest share of total café and specialty coffee spend, consistent with their population share and higher density of independent cafés.
- Income is a significant predictor of specialty coffee purchase behaviour. Roy Morgan data consistently shows that households in the top two income quintiles are disproportionately represented among regular specialty café visitors and home espresso machine owners.
- A study referenced by the Australian Coffee Traders Association found that female coffee drinkers show a slightly higher preference for milk-based formats (lattes, flat whites, cappuccinos), while male drinkers show a slightly higher preference for black coffee formats, though the difference has narrowed over the past decade.
- Workplace demographic data matters practically. A 20-person engineering firm with a predominantly male team in their 30s will have a different consumption pattern than a 60-person professional services office with a mixed age and gender profile. Matching the coffee setup to the actual team composition, rather than using a default spec, is how unnecessary spend and underperformance both get avoided.
6. Sustainability and Specialty Coffee Growth
The sustainability and specialty segments are among the most commercially active areas of the Australian coffee market, and both have implications for procurement, supplier selection, and workplace coffee programmes.
- According to the Specialty Coffee Association (sca.coffee), Australia has one of the highest per-capita concentrations of Specialty Coffee Association-certified professionals (Q Graders, SCA diploma holders) outside of Europe and North America.
- Certified ethical and sustainable coffee certifications (Fairtrade, Rainforest Alliance, organic) now appear on a growing proportion of retail coffee products in Australian supermarkets, with Fairtrade Australia (fairtrade.com.au) reporting consistent growth in certified product volume.
- IBISWorld Australia notes that consumer preference for single-origin and micro-lot coffees has grown each year since 2018, contributing to higher average spend per kg among specialty buyers.
- A Rabobank report on global coffee sustainability trends noted that Australian roasters and importers are increasingly investing in direct-trade relationships, partly driven by consumer demand and partly by supply chain risk management following global arabica price volatility.
- Compostable and biodegradable capsule formats have grown as a share of the Australian retail capsule market, with several major supermarket own-label ranges now offering certified compostable options.
- According to data cited by the Australian Coffee Traders Association, the proportion of Australian cafés offering at least one non-dairy milk option (oat, almond, soy, macadamia) now exceeds 90%, with oat milk overtaking soy as the most commonly ordered alternative in capital city cafés.
7. Australian Market Statistics: Workplace Coffee Benchmarks
This section focuses specifically on data points relevant to workplace coffee programmes in Australia, drawing on employer surveys, workplace amenity research, and operational data.
- A survey of Australian HR professionals cited in industry reporting found that approximately 55% of respondents agreed that coffee machine quality was a factor in how positively staff rated their workplace amenity.
- According to IBISWorld Australia, the market for commercial coffee machine rental and leasing in Australian workplaces has grown alongside the broader return-to-office movement in 2023-2025.
- Coffee is consistently ranked among the top three workplace amenities by Australian office workers, alongside wi-fi speed and air conditioning, in multiple employer satisfaction surveys.
- Roy Morgan Research has found that approximately 60% of Australian office workers purchase at least one café coffee per working day, representing a significant daily expenditure that workplace coffee programmes can partially offset.
- Average spend on a café coffee in Australia reached approximately $5.50-6.00 AUD per cup in major capital cities in 2025, according to data cited by Square Australia and industry tracking by IBISWorld.
- Workplace coffee machine programmes that provide café-quality espresso are estimated to generate cost savings for individual employees of $15-25 AUD per week compared to daily café visits, based on the price differential between workplace-supplied coffee and retail café pricing.
- Organisations with more than 50 employees who offer quality in-office coffee report lower rates of mid-morning and mid-afternoon productivity dips, according to employer wellness surveys cited in HR industry publications.
For practitioners designing a workplace coffee programme from scratch, the data above is a useful baseline. The Boutique Coffee at Work workplace coffee solutions page contains practical guidance on matching machine capacity to team size, which is one of the most commonly underestimated variables in workplace coffee planning. Getting that match wrong in either direction means either a queue at 9am or a machine running at 20% capacity that never justifies the bench space.
Table 4: Workplace Coffee Benchmarks by Team Size (Australia, 2026)
| Team Size | Estimated Daily Cups | Recommended Machine Tier | Monthly Bean Consumption (est.) | Avg. Cost per Cup (AUD) |
|---|---|---|---|---|
| 5-15 staff | 15-45 cups/day | Entry-level commercial | 2-4 kg | $0.50-0.90 |
| 16-30 staff | 45-90 cups/day | Mid-tier commercial | 4-8 kg | $0.45-0.80 |
| 31-60 staff | 90-180 cups/day | Commercial super-auto | 8-16 kg | $0.40-0.70 |
| 61-120 staff | 180-360 cups/day | High-capacity commercial | 16-30 kg | $0.35-0.60 |
| 120+ staff | 360+ cups/day | Multi-machine or barista setup | 30+ kg | $0.30-0.55 |
Note: These benchmarks are estimates based on industry averages. Actual consumption varies by team culture, office hours, and coffee programme scope.
Key Takeaways
The data presented across this article points to several clear conclusions for practitioners.
Consumption is growing, not plateauing. Per-capita consumption and total import volumes have increased consistently across the 2020-2026 period. Organisations that treated workplace coffee as a fixed-cost line item may need to revisit that assumption.
Workplace coffee has a retention and amenity dimension. Multiple survey sources indicate that coffee quality is a genuine factor in how Australian office workers evaluate their workplace. The data is strong enough to include in a business case for upgrading a coffee setup.
Format preferences are shifting. Cold brew and specialty formats are growing. A workplace programme anchored entirely on a capsule machine and a single bland blend is increasingly out of step with what Australian workers expect, particularly in the 25-44 demographic.
The café price gap is widening. At $5.50-6.00 AUD per cup in capital city cafés, the cost-per-cup differential between a well-run workplace coffee programme and daily café visits is meaningful. Workers who drink two cups a day at a café spend approximately $55-60 AUD per week. A quality workplace programme running at $0.40-0.80 per cup represents a significant per-person saving over the course of a year.
Sustainability is now a baseline expectation, not a differentiator. More than 90% of Australian cafés now offer non-dairy milk options, and certified ethical sourcing is a growing expectation at the trade level. Workplace programmes should be able to account for their supply chain credentials when asked.
Right-sizing matters. The single most common error in workplace coffee procurement is machine and supply mismatch. A machine specced for 15 people will break down in a 60-person office within months. An oversized machine in a small office wastes bench space and budget. The benchmarks in Table 4 above provide a starting point for any right-sizing exercise.
Organisations reviewing their current workplace coffee arrangements can compare their setup against the benchmarks here. If the numbers suggest a significant mismatch, the Boutique Coffee at Work free trial page provides a practical starting point for assessing alternatives without a long-term commitment.
Methodology and Disclaimer
Statistics in this article have been sourced from publicly available research, industry reports, government data, and market analysis published prior to the article's publication date. Where precise figures were not available, estimates have been presented as such and labelled accordingly. Year-over-year trend data in tables represents best available estimates based on aggregated sources and should be treated as indicative rather than definitive.
Individual statistics should be verified against primary sources before use in academic work, formal business cases, or published research. Market sizing figures in particular vary between research providers depending on methodology and scope.
The article was compiled with reference to data from the Australian Bureau of Statistics, IBISWorld Australia, Roy Morgan Research, Statista, the International Coffee Organization, the Specialty Coffee Association, Rabobank, the Australian Coffee Traders Association, Fairtrade Australia, the Australian Competition and Consumer Commission, and Square Australia, among others. Full source details are listed below.
For context on year-over-year trends in earlier years, refer to the companion article Australian Workplace Coffee Statistics 2025.
Sources
- Australian Bureau of Statistics - Trade in Goods and Services. abs.gov.au. https://www.abs.gov.au/statistics/economy/international-trade/international-trade-goods-and-services-australia
- IBISWorld Australia - Coffee Industry Reports (Cafes and Coffee Shops; Coffee Roasting). ibisworld.com. https://www.ibisworld.com/au/
- Roy Morgan Research - Coffee Consumption Australia. roymorgan.com. https://www.roymorgan.com
- International Coffee Organization - Coffee Report and Outlook. ico.org. https://www.ico.org/new_historical.asp
- Statista - Coffee in Australia market data. statista.com. https://www.statista.com/topics/4820/coffee-in-australia/
- Specialty Coffee Association - Industry Reports and Global Barista Data. sca.coffee. https://sca.coffee/research
- Rabobank - Global Coffee Outlook and Sustainability Reports. rabobank.com. https://www.rabobank.com/en/about-rabobank/food-agribusiness/coffee.html
- Australian Coffee Traders Association - Industry data and market commentary. australiancoffeetraders.com.au
- Fairtrade Australia and New Zealand - Certified Product Volume Data. fairtrade.com.au. https://www.fairtrade.com.au
- Australian Competition and Consumer Commission - Market reviews and industry data. accc.gov.au. https://www.accc.gov.au
- Square Australia - Café and Restaurant Report (Australian edition). squareup.com/au. https://squareup.com/au/en/townsquare/australia-cafe-report
- Workplace Gender Equality Agency - Employer Survey Data on Workplace Amenity. wgea.gov.au. https://www.wgea.gov.au
- AC Nielsen (NIQ) Australia - Retail coffee category data. nielseniq.com. https://nielseniq.com/global/en/landing-page/australia/
Frequently asked questions
How much coffee does the average Australian drink per day?
The average Australian adult who drinks coffee consumes approximately 2.5-3 cups per day, though this varies by age, occupation, and whether they are working from home or in an office. Per-capita consumption across the total population is approximately 2.1 kg of roasted coffee annually.
What is the most popular coffee order in Australia?
The flat white is the most-ordered espresso drink at Australian cafes, accounting for approximately 26-28% of all espresso-based orders. The latte is the second most popular, followed by the cappuccino and the long black.
How big is the Australian coffee market in 2026?
The Australian coffee market, including cafe revenues, retail sales, and the coffee roasting industry, is estimated at approximately $10 billion AUD in total economic value. The cafe and foodservice segment is the largest component, followed by retail (beans, ground, capsules, instant).
How much coffee do Australian workplaces consume?
Workplace consumption is estimated to account for 35-40% of all out-of-home coffee occasions in Australia. Office workers consume an average of approximately 2.8 cups of coffee per day on days spent in the office, compared to around 2.2 cups on work-from-home days.
What are the trends in specialty and sustainable coffee in Australia?
Specialty coffee has grown consistently as a share of Australian cafe orders since 2018. Single-origin, direct-trade, and ethically certified coffees are increasingly the baseline expectation. Non-dairy milk alternatives are now available at more than 90% of Australian cafes, with oat milk the most commonly ordered option in capital cities.
How does Australia rank globally for coffee consumption?
Australia ranks in the top 15 consuming nations globally on a per-capita basis, with approximately 2.1 kg of roasted coffee consumed per person per year. This places Australia ahead of the United States and the United Kingdom on a per-capita measure.
How much does a workplace coffee programme typically cost per cup in Australia?
A well-configured commercial coffee machine rental with bean supply included typically delivers coffee at approximately $0.35-0.90 AUD per cup depending on team size and machine tier. This compares to a retail cafe price of $5.50-6.00 AUD per cup in major Australian cities in 2025-2026.
Chris
Chris
Keep reading
Buying Bulk Coffee Beans for the Office: Cost, Freshness & Supply Guide
Most Australian businesses buy coffee the wrong way. They focus entirely on the upfront price per kilogram and completely ignore the logistical reality of…
Barista-Quality Office Coffee: How to Replicate the Cafe Experience at Work
There is a glaring contradiction in many Australian workplaces. Staff walk through Melbourne's laneways, past world-class cafes, to reach an office stocked…
Commercial Office Coffee Vending Machines: Are They Worth It for Australian Workplaces?
Walk into any Australian office and you will see the same behaviour pattern. People arrive, drop their bags, and head straight for the kitchen. They want…