
Key Statistics Summary
- According to McCrindle Research (https://mccrindle.com.au/article/blog/australias-changing-coffee-culture/), 75% of surveyed Australians drank at least one cup of coffee each day.
- According to McCrindle Research (https://mccrindle.com.au/article/blog/australias-changing-coffee-culture/), 28% of surveyed Australians drank three or more cups per day.
- According to McCrindle Research (https://mccrindle.com.au/article/blog/australias-changing-coffee-culture/), 27% of respondents said they could not survive the day without coffee.
- According to the National Coffee Association (https://www.ncausa.org/Newsroom/Coffee-consumption-hits-20-year-high), 67% of American adults drank coffee during the previous day in its spring 2024 survey, the highest level reported in two decades.
- According to the same National Coffee Association release, 45% of American adults had consumed speciality coffee during the previous day.
- According to the Australian Bureau of Statistics (https://www.abs.gov.au/statistics/people/people-and-communities/working-arrangements/latest-release), 37% of employed Australians usually worked from home in August 2023, compared with 40% in August 2021.
- According to the European Food Safety Authority (https://www.efsa.europa.eu/en/efsajournal/pub/4102), daily caffeine intake of up to 400 mg does not generally raise safety concerns for healthy, non-pregnant adults.
- According to Boutique Coffee's own 2026 business data, its active Melbourne workplace rental base includes more than 200 clients, with an average active-client relationship exceeding five years.
Introduction
Coffee is both a consumer habit and a workplace amenity. That makes corporate coffee trends relevant to facilities managers, office managers, people and culture teams, procurement specialists, hospitality operators and business owners. Consumption data indicates how frequently people drink coffee, while workplace attendance data helps explain where those drinks are prepared and purchased. Machine selection, service reliability and drink variety then determine whether an office system can meet that demand.
The evidence is not equally strong across every part of the market. Australia has credible national data on coffee consumption, food supply, working arrangements and household spending categories. It does not have a comprehensive public dataset that isolates office coffee expenditure, cups served in workplaces or commercial machine preferences by team size. This 2026 report therefore separates published statistics from market interpretation, international comparison data and Boutique Coffee's clearly labelled business records. It does not present unsupported estimates as national benchmarks.
Australian Coffee Consumption Statistics
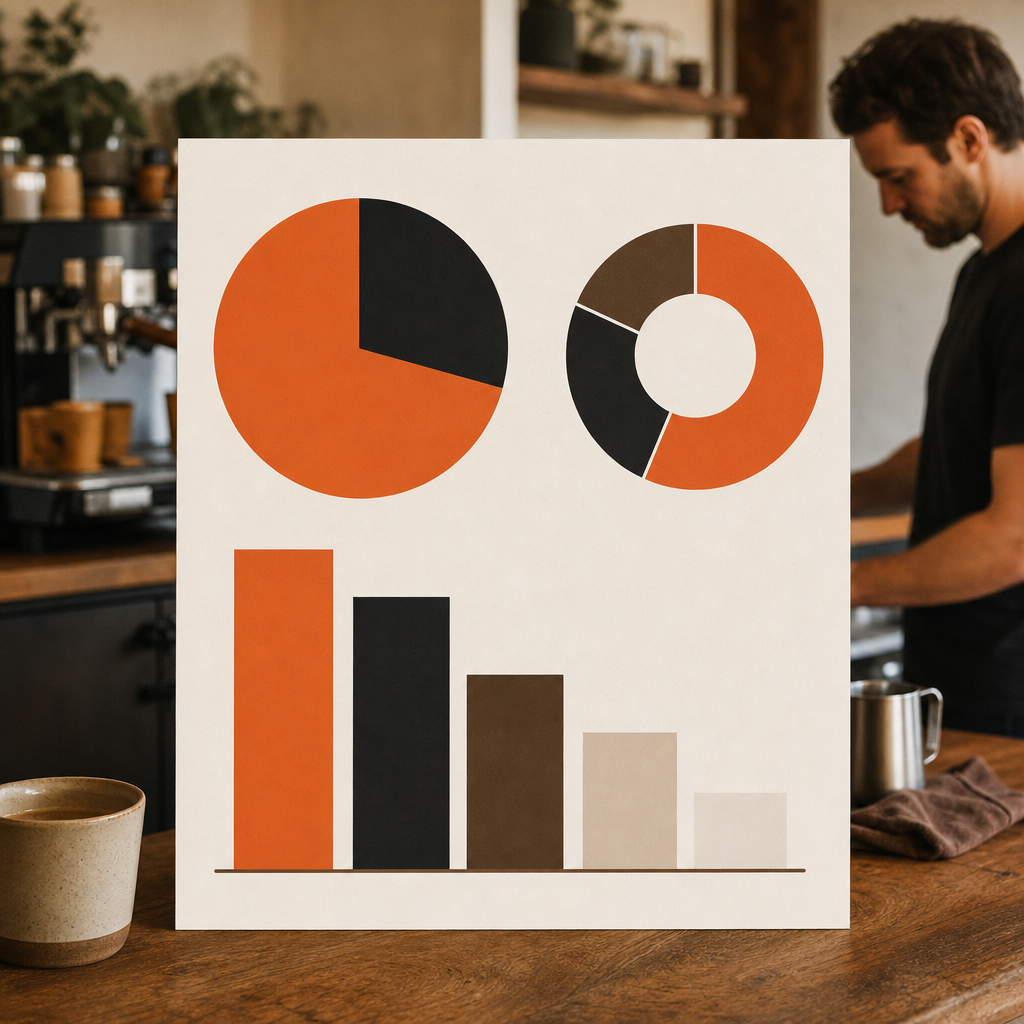
Coffee has a large established audience in Australia, but the way consumption is measured matters. Some surveys ask whether a person drinks coffee daily. Others measure cups, recent consumption or apparent food supply. Those metrics are related, but they are not interchangeable.
- According to McCrindle Research (https://mccrindle.com.au/article/blog/australias-changing-coffee-culture/), 75% of Australians in its research drank at least one cup of coffee per day.
- According to McCrindle Research, 28% of surveyed Australians consumed three or more cups per day. For employers, this indicates that workplace demand is not limited to a single morning service window.
- According to McCrindle Research, 27% of respondents said they could not survive the day without coffee. This is a measure of stated sentiment rather than a clinical measure of dependence, but it illustrates the strength of the habit.
- According to the Australian Bureau of Statistics (https://www.abs.gov.au/statistics/health/food-and-nutrition/apparent-consumption-selected-foodstuffs-australia/latest-release), its apparent-consumption series measures the amount of food available for consumption from supply data. The ABS cautions that this is not the same as the amount actually eaten or drunk by individuals.
- According to the International Coffee Organization (https://ico.org/what-we-do/world-coffee-statistics-database/), international coffee statistics are commonly recorded using 60 kg bags. This trade measure should not be confused with cups consumed or retail purchases.
The following table summarises the most directly relevant Australian survey findings. All percentages come from the cited McCrindle research.
| Australian coffee indicator | Reported result | What the result measures | Source |
|---|---|---|---|
| Respondents drinking at least one cup daily | 75% | Daily coffee participation | McCrindle Research (https://mccrindle.com.au/article/blog/australias-changing-coffee-culture/) |
| Respondents drinking three or more cups daily | 28% | Higher-frequency consumption | McCrindle Research (https://mccrindle.com.au/article/blog/australias-changing-coffee-culture/) |
| Respondents saying they could not survive the day without coffee | 27% | Self-reported importance of coffee | McCrindle Research (https://mccrindle.com.au/article/blog/australias-changing-coffee-culture/) |
These results support a practical conclusion for workplace planners: capacity should be based on drinks across the working day, not simply the number of employees. A workplace with frequent coffee drinkers can place substantially more demand on a machine than an equally sized workplace with lower participation.
National supply and survey statistics also answer different questions. ABS apparent-consumption data is useful for monitoring broad changes in the amount of coffee available to Australians. Consumer surveys are more useful for understanding frequency and preference. Neither dataset shows how many drinks are made in offices, how much employers spend or which machine category is installed.
International figures can provide context, although they should not be treated as Australian office coffee statistics. According to the National Coffee Association (https://www.ncausa.org/Newsroom/Coffee-consumption-hits-20-year-high), 67% of American adults drank coffee during the previous day in its spring 2024 survey. The association reported that this was the highest past-day level in two decades. Differences in survey design, population and café culture mean that direct country rankings would require a harmonised dataset.
Coffee at Work and Hybrid Attendance Data

Workplace caffeine trends are now inseparable from hybrid attendance. A business may have a large total headcount but a much smaller number of people present on an average day. Conversely, mandated office days can concentrate demand into particular mornings and lunch periods.
- According to the Australian Bureau of Statistics (https://www.abs.gov.au/statistics/people/people-and-communities/working-arrangements/latest-release), 37% of employed Australians usually worked from home in August 2023.
- According to the ABS, 40% of employed Australians usually worked from home in August 2021. The later result therefore remained above pre-pandemic norms even after restrictions had eased.
- According to the ABS, working from home is more common in some occupations and industries than others. National averages should not be used as direct attendance assumptions for an individual workplace.
- According to the Fair Work Ombudsman (https://www.fairwork.gov.au/employment-conditions/hours-of-work-breaks-and-rosters/hours-of-work), the National Employment Standards set a maximum of 38 ordinary hours per week for a full-time employee, unless additional hours are reasonable. This defines a broad employment standard, not the hours during which an office coffee machine will experience demand.
- According to Safe Work Australia (https://www.safeworkaustralia.gov.au/safety-topic/hazards/sedentary-work), sedentary work is associated with occupational health risks and should be interrupted where possible. A coffee station may create an informal movement point, although available evidence does not establish that installing one produces a measurable health or productivity outcome.
| Australian working arrangement | August 2021 | August 2023 | Source |
|---|---|---|---|
| Employed people who usually worked from home | 40% | 37% | Australian Bureau of Statistics (https://www.abs.gov.au/statistics/people/people-and-communities/working-arrangements/latest-release) |
The ABS figures show why total headcount is no longer a sufficient sizing measure. Office coffee planning should distinguish among total employees, typical daily attendance and peak attendance. It should also identify whether teams share the same office days. A hybrid office may have moderate weekly demand but intense peaks when most employees attend together.
Coffee at work data should ideally be tracked at site level. Useful operational measures include drinks dispensed, beans used, milk used, cleaning cycles and service events. These are management metrics rather than national statistics. They become more valuable when interpreted alongside attendance data, because a fall in total drinks may reflect fewer people on site rather than lower satisfaction with the coffee.
Daily timing also matters. Coffee demand commonly clusters around arrival, scheduled breaks and the period after lunch. However, no Australian public dataset identified for this report provides a nationally representative breakdown of office coffee orders by time of day. Claims about a universal workplace peak should therefore be treated as operational observations, not national benchmarks.
A first-hand example from Boutique Coffee's records illustrates the cost of overlooking reliability. At a busy Melbourne workplace, a machine failure during peak office hours created immediate disruption. Regular maintenance and direct contact subsequently reduced the risk of the team being left without coffee. This is an anonymised operational example, not a controlled productivity study, and no financial saving has been assigned to it.
Drink and Machine Preference Trends
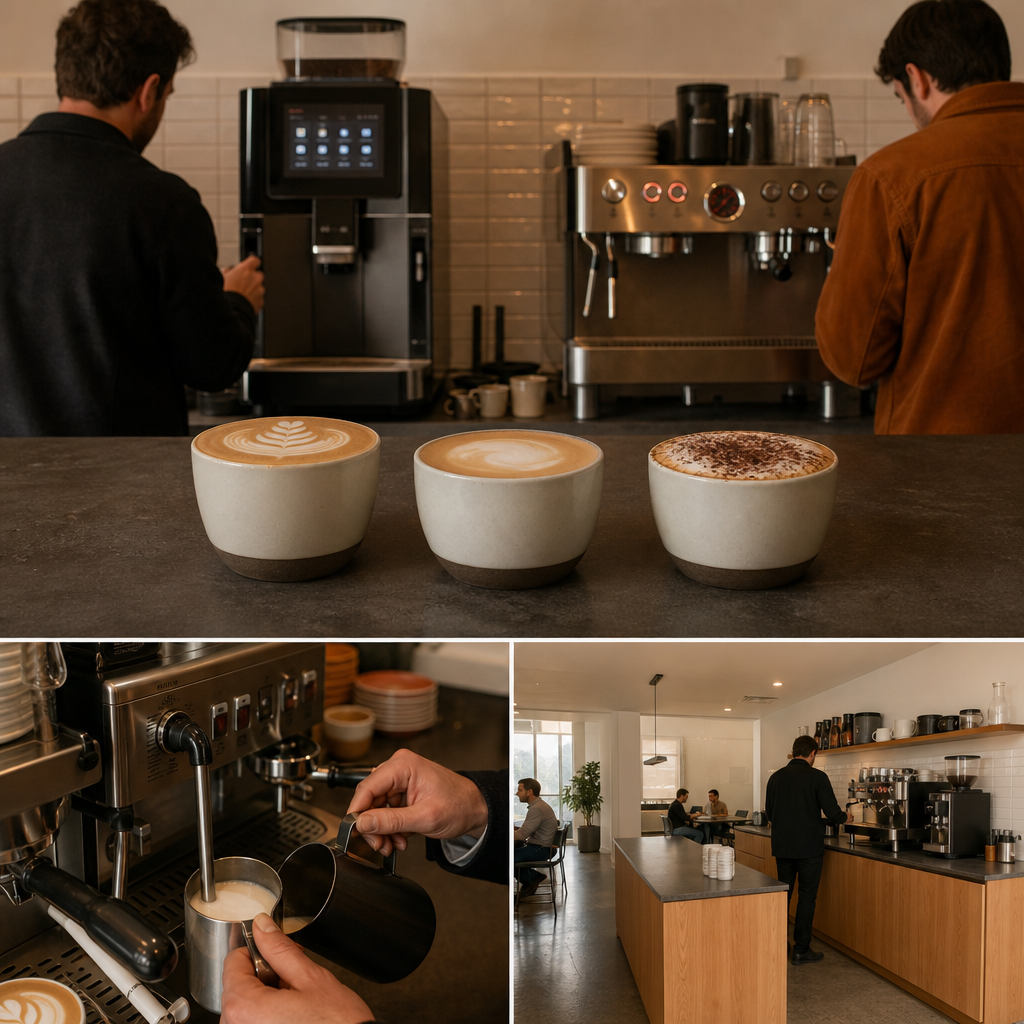
Published consumer preference data can inform office menus, but it cannot by itself determine the right machine. A preference for espresso-based drinks points towards suitable brewing and milk capability. It does not establish whether a workplace needs an automatic commercial machine, a traditional espresso system or another configuration.
- According to McCrindle Research (https://mccrindle.com.au/article/blog/australias-changing-coffee-culture/), the latte was the preferred coffee style for 33% of respondents in its Australian research.
- According to McCrindle Research, the flat white was preferred by 24% of respondents.
- According to McCrindle Research, the cappuccino was preferred by 19% of respondents.
- According to the National Coffee Association (https://www.ncausa.org/Newsroom/Coffee-consumption-hits-20-year-high), 45% of American adults consumed speciality coffee during the previous day in spring 2024. This is international context rather than an Australian benchmark.
- According to the Specialty Coffee Association (https://sca.coffee/research), coffee quality is affected by multiple variables across sourcing, roasting, grinding, water and brewing. Machine specification alone therefore cannot guarantee the result in the cup.
| Preferred coffee style among surveyed Australians | Share of respondents | Source |
|---|---|---|
| Latte | 33% | McCrindle Research (https://mccrindle.com.au/article/blog/australias-changing-coffee-culture/) |
| Flat white | 24% | McCrindle Research (https://mccrindle.com.au/article/blog/australias-changing-coffee-culture/) |
| Cappuccino | 19% | McCrindle Research (https://mccrindle.com.au/article/blog/australias-changing-coffee-culture/) |
The three listed milk-based drinks account for a substantial share of stated preferences in the cited research. For an office, that has consequences for milk storage, refrigeration, cleaning and the time required to prepare each drink. It also means that evaluating only the espresso unit can miss a major part of actual use.
There is no authoritative national table showing the share of Australian offices using bean-to-cup, capsule, instant or traditional espresso systems. Supplier surveys can describe their own customers, but they should not be represented as the whole market. Public market-research companies such as IBISWorld (https://www.ibisworld.com/au/) and Statista (https://www.statista.com/) publish broader coffee and equipment research, although detailed figures are often available only under paid access and may use different market definitions.
In the absence of national machine-share data, selection should be treated as a capacity and workflow question. Relevant factors include simultaneous demand, expected drinks per day, preferred beverages, available plumbing, power, bench space, cleaning responsibilities and access to maintenance. A home-grade machine can be unsuitable for a heavily used office even if its headline feature list looks similar to that of a commercial unit.
Boutique Coffee's author-supplied operating framework takes a deliberately non-consensus position on sizing: choose the machine for the actual team, not the most expensive future scenario. The business records include installations serving workplaces with more than 400 people, but that upper-end experience is not evidence that every site needs high-capacity equipment. The correct specification depends on observed demand.
The same principle applies to beans. The author-supplied Curated Coffee Plan starts by asking whether a team favours espresso or milk-based drinks, desired strength and disliked flavours. A blend is then selected and adjusted using feedback during the first month. This is an operational method, not a population statistic. It is relevant because preference percentages cannot replace tasting and site-specific feedback.
Workplace Coffee Spending and Cost Measurement
Corporate coffee spending is one of the least consistently measured parts of the market. Public Australian datasets generally combine coffee with broader household, café, restaurant, food-service or equipment categories. Those categories cannot be converted into an office coffee benchmark without additional assumptions.
- According to the Australian Bureau of Statistics (https://www.abs.gov.au/statistics/economy/finance/household-spending-indicator/latest-release), the Household Spending Indicator measures household expenditure across broad categories. It is not an employer purchasing survey and does not isolate workplace coffee.
- According to the ABS apparent-consumption publication (https://www.abs.gov.au/statistics/health/food-and-nutrition/apparent-consumption-selected-foodstuffs-australia/latest-release), supply-based food availability is not equivalent to consumer expenditure. Coffee volume statistics therefore cannot be multiplied by an assumed retail price to produce a reliable national spending figure.
- According to the International Coffee Organization (https://ico.org/what-we-do/world-coffee-statistics-database/), coffee data spans production, trade, prices and consumption. Differences between green coffee, roasted coffee and retail beverages must be preserved when interpreting value.
- According to the Australian Taxation Office (https://www.ato.gov.au/businesses-and-organisations/income-deductions-and-concessions/deductions/deductions-for-business), a deductible business expense must be connected with earning assessable income and supported by appropriate records. Tax treatment depends on circumstances, so general coffee expenditure should not automatically be characterised as deductible.
A credible workplace cost calculation starts with actual invoices and machine data. The following table is a measurement framework rather than a table of national averages. It avoids presenting an invented cost per cup.
| Cost component | Evidence to collect | Why it matters |
|---|---|---|
| Equipment | Rental or purchase invoices | Separates capital or rental cost from consumables |
| Coffee | Bean, ground-coffee or capsule invoices | Shows the direct coffee input cost |
| Milk and alternatives | Supplier invoices and wastage records | Captures an important cost for milk-based drinks |
| Consumables | Cups, lids, chocolate and cleaning products | Prevents undercounting ancillary expenditure |
| Maintenance | Scheduled and unscheduled service records | Identifies the cost of reliability and downtime |
| Attendance | Daily site attendance | Allows expenditure to be interpreted against actual office use |
| Output | Machine counters or stock reconciliation | Supports a site-specific cost-per-drink calculation |
A valid cost-per-drink figure requires consistent boundaries. For example, a calculation based only on beans should not be compared with another that includes equipment, milk, consumables and servicing. GST treatment should also be consistent. If one figure includes GST and another excludes it, the comparison can be misleading even when both invoice totals are accurate.
Downtime is another cost category, but it is difficult to price without local evidence. A business might record staff time spent reporting an issue, obtaining drinks elsewhere or managing refunds. It should not assign a productivity loss merely because a machine stopped working. Any estimate needs documented assumptions about the number of employees affected, the duration and the actual response.
Boutique Coffee's own 2026 records report a typical service-call response within 24 hours across its active client base. That is a supplier-specific operational measure, not an Australian industry average. It is included because response time is a relevant cost and reliability variable, but comparable public data from other suppliers is not available.
The lack of national office spending data is itself a useful finding. Facilities and procurement teams should be cautious when a report presents a precise Australian corporate cost per cup without disclosing whether it includes equipment, labour, milk, service, wastage and GST.
Caffeine, Health and Workplace Guidance
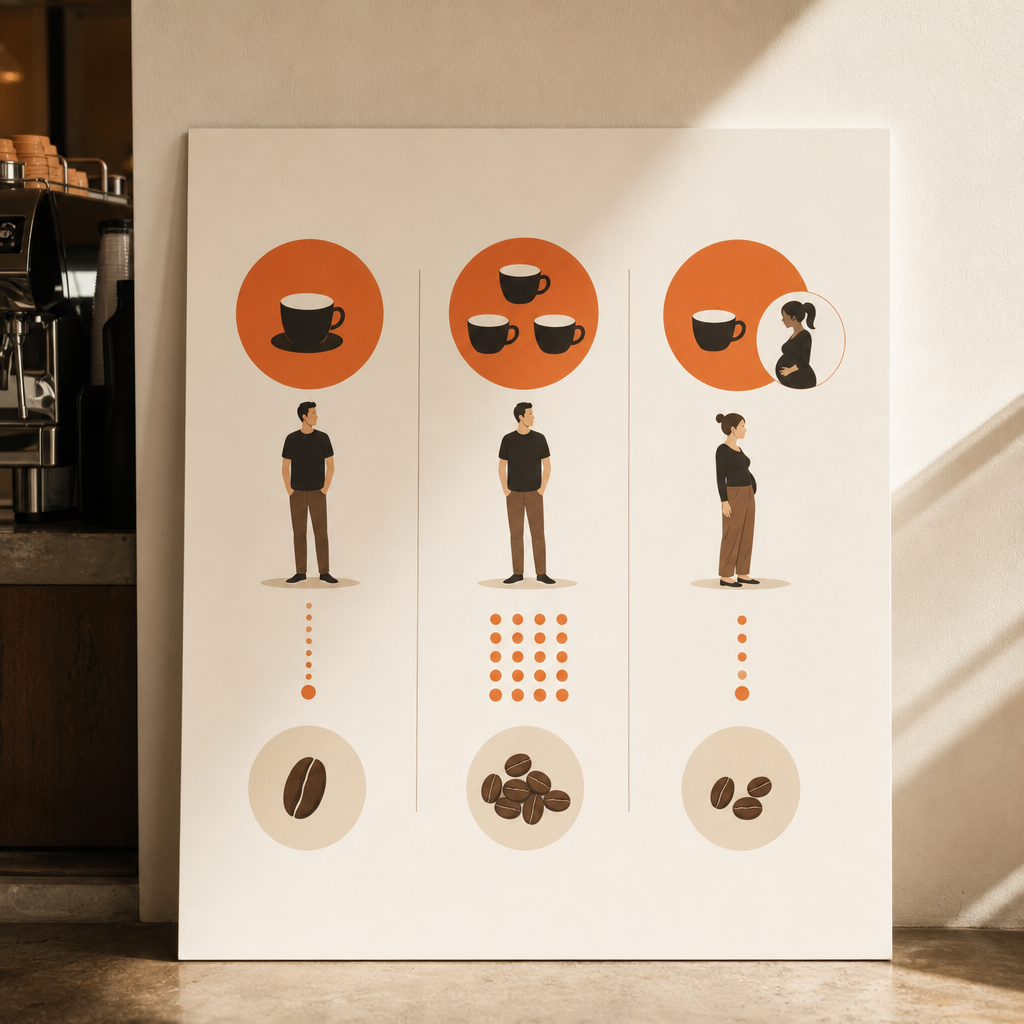
Coffee consumption is not the same as caffeine intake. The caffeine in a drink varies with bean type, dose, extraction, serving size and preparation method. Workplace guidance should therefore avoid converting cups into milligrams unless the drink has been measured or reliably specified.
- According to the European Food Safety Authority (https://www.efsa.europa.eu/en/efsajournal/pub/4102), single caffeine doses of up to 200 mg do not generally raise safety concerns for healthy adults.
- According to the same EFSA opinion, daily caffeine intake of up to 400 mg does not generally raise safety concerns for healthy, non-pregnant adults.
- According to EFSA, caffeine intake of up to 200 mg from all sources does not generally raise safety concerns for pregnant or breastfeeding women, although individual medical advice remains important.
- According to the United States Food and Drug Administration (https://www.fda.gov/consumers/consumer-updates/spilling-beans-how-much-caffeine-too-much), 400 mg per day is an amount not generally associated with negative effects for most adults. The FDA also emphasises that sensitivity varies.
- According to Food Standards Australia New Zealand (https://www.foodstandards.gov.au/consumer/generalissues/Pages/Caffeine.aspx), caffeine occurs naturally in coffee, tea and some other foods, and can also be added to certain products under food-standard restrictions.
- According to the World Health Organization (https://www.who.int/publications/i/item/9789241549028), free sugars should make up less than 10% of total energy intake, with a conditional recommendation to reduce intake below 5% for additional health benefits. This is relevant to sweetened coffee drinks rather than unsweetened coffee itself.
- According to the International Agency for Research on Cancer (https://www.iarc.who.int/wp-content/uploads/2018/07/pr244_E.pdf), drinking very hot beverages above 65 degrees Celsius was classified as probably carcinogenic to humans. The finding concerned beverage temperature, not coffee as a beverage category.
| Authority | Population or exposure | Guidance | Source |
|---|---|---|---|
| European Food Safety Authority | Healthy adults, single dose | Up to 200 mg caffeine does not generally raise safety concerns | EFSA (https://www.efsa.europa.eu/en/efsajournal/pub/4102) |
| European Food Safety Authority | Healthy, non-pregnant adults, daily intake | Up to 400 mg caffeine does not generally raise safety concerns | EFSA (https://www.efsa.europa.eu/en/efsajournal/pub/4102) |
| European Food Safety Authority | Pregnant or breastfeeding women, daily intake from all sources | Up to 200 mg caffeine does not generally raise safety concerns | EFSA (https://www.efsa.europa.eu/en/efsajournal/pub/4102) |
| United States Food and Drug Administration | Most adults, daily intake | 400 mg is not generally associated with negative effects | FDA (https://www.fda.gov/consumers/consumer-updates/spilling-beans-how-much-caffeine-too-much) |
| International Agency for Research on Cancer | Very hot beverages | Above 65 degrees Celsius classified as probably carcinogenic to humans | IARC (https://www.iarc.who.int/wp-content/uploads/2018/07/pr244_E.pdf) |
These values are population-level guidance, not personal prescriptions. Sleep, medication, pregnancy, health conditions and individual sensitivity can alter how a person responds. Employers should make water and non-caffeinated alternatives available rather than treating coffee as a substitute for hydration or rest.
Labelling can also be useful where a machine offers additional ingredients. Chocolate powders, syrups and sweetened milk alternatives can materially change the energy and sugar content of a drink. The WHO sugar recommendation should not be interpreted as a coffee limit, but it supports making unsweetened options available.
Temperature deserves practical attention. Coffee should be hot enough to be acceptable and safely prepared, but serving it at unnecessarily high temperatures creates a burn risk. The IARC classification addresses long-term consumption of very hot beverages and does not establish that a particular office machine is unsafe. Equipment instructions and workplace risk procedures remain the appropriate operational references.
Australian Market Statistics
Australian corporate coffee sits at the intersection of a strong national coffee culture and a hybrid workforce. The available evidence supports several observations, while also exposing important data gaps.
- According to McCrindle Research (https://mccrindle.com.au/article/blog/australias-changing-coffee-culture/), 75% of surveyed Australians drank at least one coffee daily, indicating a broad potential user base for workplace systems.
- According to McCrindle Research, latte, flat white and cappuccino preferences were reported by 33%, 24% and 19% of respondents respectively. Milk-based espresso drinks are therefore important when considering an Australian workplace menu.
- According to the ABS (https://www.abs.gov.au/statistics/people/people-and-communities/working-arrangements/latest-release), 37% of employed Australians usually worked from home in August 2023. Corporate demand should consequently be modelled using attendance rather than payroll headcount alone.
- According to Boutique Coffee's 2026 internal data, the business has more than 200 active Melbourne workplace rental clients.
- According to the same internal data, the average relationship across the active client base exceeds five years.
- According to Boutique Coffee's internal service data, the typical response time for a service call is within 24 hours.
- According to Boutique Coffee's supplied operating history, it has worked exclusively in workplace coffee for 17 years and has installed systems for individual workplace populations exceeding 400 people.
| Melbourne workplace operating indicator | Boutique Coffee's 2026 result | Status of figure |
|---|---|---|
| Active workplace rental clients | More than 200 | Proprietary business data, not a national market estimate |
| Average active-client relationship | More than 5 years | Proprietary business data |
| Typical service-call response time | Within 24 hours | Proprietary business data |
| Exclusive operating history | 17 years | Author-supplied business history |
| Largest workplace population served at one site | More than 400 people | Proprietary business data |
These figures describe one Melbourne operator and should not be extrapolated to calculate Australian market share, total installations or industry retention. Their value is narrower: they provide transparent examples of the operating metrics a workplace coffee provider can track.
The Australian market still lacks several public benchmarks that would improve comparison. These include annual employer spending on coffee, the share of workplaces offering each machine type, average drinks dispensed per employee, equipment downtime, contract length and satisfaction by workplace size. IBISWorld Australia (https://www.ibisworld.com/au/) covers relevant commercial sectors, while the ACCC (https://www.accc.gov.au/business/pricing/price-displays) publishes rules and guidance concerning pricing displays. Neither provides a free national series that answers all of these corporate coffee questions.
For buyers comparing offers, the absence of market-wide averages makes transparent scope more important. Equipment, installation, training, servicing, consumables, response arrangements and exit conditions should be compared separately. A low headline rental figure cannot be assessed properly if mandatory consumables or service exclusions are unclear.
Boutique Coffee's stated model is founder-led, always, with one number, one person responsible from installation through ongoing service. Its rentals are described as month-to-month rather than long-term contracts. Those are business policies, not statistics about the wider market. They align with the report's broader finding that accountability, response records and correct capacity are more measurable than unsupported claims about productivity.
The organisation's Six-Step Process also supplies a documented implementation sequence. According to the author's own framework, the enquiry takes approximately two minutes, the initial call takes 15-20 minutes, the site assessment takes approximately 30 minutes, installation takes approximately 45 minutes and initial training takes approximately 20 minutes. The supplied framework states that most Melbourne installations progress from first call to installed machine in five to seven business days. These are internal operating targets, not Australian industry benchmarks.
Key Takeaways
-
Use attendance, not total headcount. According to the ABS working-arrangements release, 37% of employed Australians usually worked from home in August 2023. A site should document typical and peak attendance before choosing capacity.
-
Plan for repeated use across the day. According to McCrindle Research, 28% of surveyed Australians drank three or more cups daily. One drink per employee is therefore an unsuitable universal planning assumption.
-
Give milk systems proper weight. According to McCrindle Research, latte, flat white and cappuccino were preferred by 33%, 24% and 19% of respondents respectively. Milk storage, cleaning and throughput should be evaluated alongside espresso output.
-
Do not quote a national office cost per cup without a disclosed method. No authoritative public Australian dataset identified for this report isolates all employer coffee costs. Site calculations should state whether equipment, beans, milk, consumables, service, wastage and GST are included.
-
Track reliability as an operating measure. Service response time, downtime, repeat faults and preventive maintenance are more useful than vague promises. Boutique Coffee's reported 24-hour typical response is supplier-specific and should be compared with equivalent, clearly defined data from other providers.
-
Keep caffeine guidance in perspective. According to EFSA, up to 400 mg per day does not generally raise safety concerns for healthy, non-pregnant adults, but individual sensitivity varies. Cup counts should not be converted into caffeine amounts without reliable product information.
-
Treat machine choice as a fit decision. National preference statistics can guide menus, but they do not decide equipment capacity. Actual drinks, peak demand, space, plumbing, cleaning and service access should determine the specification.
-
Separate evidence from supplier policy. Month-to-month rental, direct support and bean matching may be relevant buying criteria, but they are not market statistics. Procurement comparisons should clearly distinguish published evidence, contractual terms and supplier-specific performance records.
Methodology and Disclaimer
This report aggregates publicly available statistics and guidance from recognised sources, including the Australian Bureau of Statistics, McCrindle Research, the International Coffee Organization, the National Coffee Association, EFSA, the FDA, Food Standards Australia New Zealand, the World Health Organization, IARC, Safe Work Australia and the Fair Work Ombudsman.
Australian data was prioritised where a suitable source existed. International evidence was included only where it provided useful context or health guidance, and it has been labelled accordingly. Consumer survey results, trade measures, apparent consumption and workplace attendance measure different concepts and should not be combined without an explicit methodology.
Boutique Coffee's client counts, relationship duration, response time, operating history, installation range and process timings were supplied by the business for this 2026 report. They have not been independently audited and must not be extrapolated to the national market. The company's site separately documents its workplace coffee solutions, free-trial policy and contact information.
Statistics sourced from publicly available research and industry reports. Verify individual figures before publishing. Source pages, methodologies and datasets can be revised after publication. Health information is general and is not a substitute for individual medical advice. Tax information is general and is not financial or taxation advice.
Sources
- Australian Bureau of Statistics, "Working arrangements": https://www.abs.gov.au/statistics/people/people-and-communities/working-arrangements/latest-release
- Australian Bureau of Statistics, "Apparent Consumption of Selected Foodstuffs, Australia": https://www.abs.gov.au/statistics/health/food-and-nutrition/apparent-consumption-selected-foodstuffs-australia/latest-release
- Australian Bureau of Statistics, "Household Spending Indicator": https://www.abs.gov.au/statistics/economy/finance/household-spending-indicator/latest-release
- McCrindle Research, "Australia's changing coffee culture": https://mccrindle.com.au/article/blog/australias-changing-coffee-culture/
- National Coffee Association, "Coffee consumption hits 20-year high": https://www.ncausa.org/Newsroom/Coffee-consumption-hits-20-year-high
- International Coffee Organization, World Coffee Statistics Database: https://ico.org/what-we-do/world-coffee-statistics-database/
- European Food Safety Authority, "Scientific Opinion on the safety of caffeine": https://www.efsa.europa.eu/en/efsajournal/pub/4102
- United States Food and Drug Administration, "Spilling the Beans: How Much Caffeine is Too Much?": https://www.fda.gov/consumers/consumer-updates/spilling-beans-how-much-caffeine-too-much
- Food Standards Australia New Zealand, caffeine consumer information: https://www.foodstandards.gov.au/consumer/generalissues/Pages/Caffeine.aspx
- World Health Organization, "Guideline: Sugars intake for adults and children": https://www.who.int/publications/i/item/9789241549028
- International Agency for Research on Cancer, evaluation of coffee, maté and very hot beverages: https://www.iarc.who.int/wp-content/uploads/2018/07/pr244_E.pdf
- Safe Work Australia, "Sedentary work": https://www.safeworkaustralia.gov.au/safety-topic/hazards/sedentary-work
- Fair Work Ombudsman, "Hours of work": https://www.fairwork.gov.au/employment-conditions/hours-of-work-breaks-and-rosters/hours-of-work
- Specialty Coffee Association, research resources: https://sca.coffee/research
- Australian Taxation Office, business deductions: https://www.ato.gov.au/businesses-and-organisations/income-deductions-and-concessions/deductions/deductions-for-business
- Australian Competition and Consumer Commission, pricing displays: https://www.accc.gov.au/business/pricing/price-displays
- IBISWorld Australia, Australian industry research: https://www.ibisworld.com/au/
- Statista, coffee market and consumer research portal: https://www.statista.com/
- Boutique Coffee, proprietary Melbourne client and operating data supplied for this 2026 report.
FAQ_SCHEMA_JSON
Frequently asked questions
What are the most important Australian corporate coffee trends for 2026?
The clearest trends are high daily coffee participation, continued demand for milk-based espresso drinks and workplace attendance shaped by hybrid work. McCrindle Research reported that 75% of surveyed Australians drank coffee daily, while the ABS reported that 37% of employed Australians usually worked from home in August 2023.
How many Australians drink coffee every day?
According to McCrindle Research, 75% of surveyed Australians drank at least one cup of coffee each day.
What coffee drinks are most popular in Australia?
According to McCrindle Research, latte was preferred by 33% of respondents, flat white by 24% and cappuccino by 19%.
How much do Australian businesses spend on office coffee?
No authoritative public dataset identified in this report provides a complete national total for Australian employer spending on office coffee. Businesses should calculate site-level costs using equipment, coffee, milk, consumables, maintenance, wastage and GST.
How should a business choose an office coffee machine?
Machine selection should consider typical and peak attendance, drinks per day, preferred beverages, available space, power, plumbing, cleaning responsibilities and service coverage.
What is a generally recognised daily caffeine limit?
According to the European Food Safety Authority, caffeine intake of up to 400 mg per day does not generally raise safety concerns for healthy, non-pregnant adults. Individual sensitivity varies.
Chris
Chris
Keep reading
Which Melbourne Industries Rent Commercial Coffee Machines (And What Each One Actually Needs)
Melbourne businesses across professional services, medical and allied health, warehousing, manufacturing, education, and creative workplaces all rent…
Types of Office Coffee Machines: Finding the Right System for Your Australian Business
Office coffee machine types fall into four main categories: automatic bean-to-cup, traditional espresso, filter or batch brew, and pod or capsule systems. The…
27 Workplace Coffee Statistics for 2025: Australian Consumption, Costs & Trends
Key Statistics at a Glance Australians drink approximately 3.2 kg of coffee per person per year, placing the country among the top coffee-consuming nations in…