Key Statistics Summary
- Around two in three Australian adults drink coffee, according to Roy Morgan (https://www.roymorgan.com/). That is roughly 66 percent of the population regularly consuming coffee.
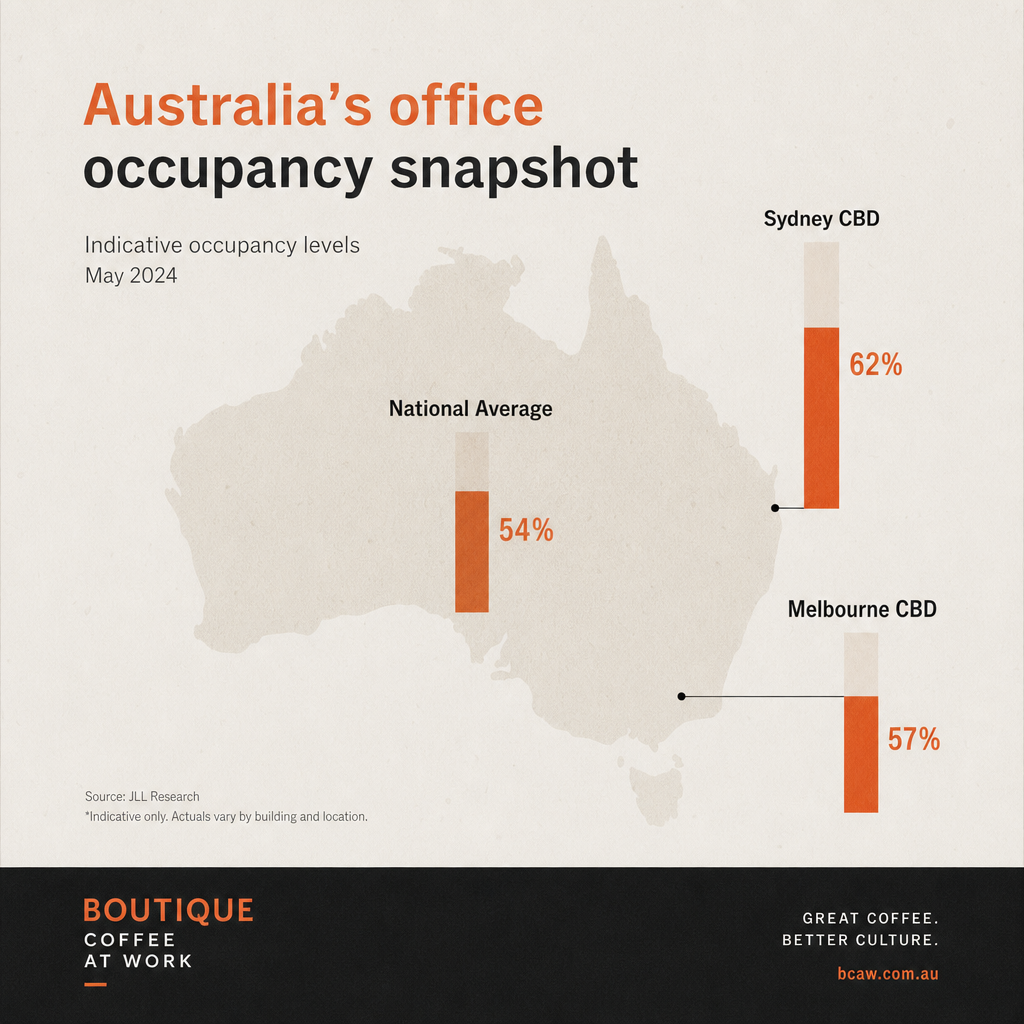
- National CBD office occupancy has broadly returned to the 70 percent range across 2024-2025, with Melbourne tracking in the mid 60s to low 70s, according to the Property Council of Australia (https://www.propertycouncil.com.au/office-occupancy).
- Australia uses about 1 billion disposable coffee cups a year, according to ABC News Science reporting on War on Waste (https://www.abc.net.au/news/science/2018-01-26/war-on-waste-coffee-cups-recycling/9366500).
- The Specialty Coffee Association recommends espresso machine feed water at 75-250 mg/L total dissolved solids, 50-175 mg/L total hardness, and around 40 mg/L alkalinity for best taste and longevity (https://sca.coffee/research/coffee-standards/water-standards).
- International Coffee Organization data indicates Australia is a mature coffee-importing market with per capita consumption around the low single digit kilograms of green coffee per year, comparable to other developed markets (https://www.ico.org/).
- Boutique Coffee at Work operates 200 plus active Melbourne workplace rentals in 2026, averages 24 hour response on service calls, and maintains client relationships for 5 plus years across its base, based on internal records.
- Workplace coffee purchasing, rentals, and servicing are often financed as operating expenses. AFIA recognises equipment finance as a major channel for Australian businesses acquiring machinery and equipment (https://www.afia.asn.au/equipment-finance).
- Statista's Market Outlook tracks Australia's coffee machine market at hundreds of millions of dollars in annual consumer sales, with continued growth into 2026 (https://www.statista.com/outlook/cmo/consumer-electronics/small-kitchen-appliances/coffee-machines/australia).
Introduction
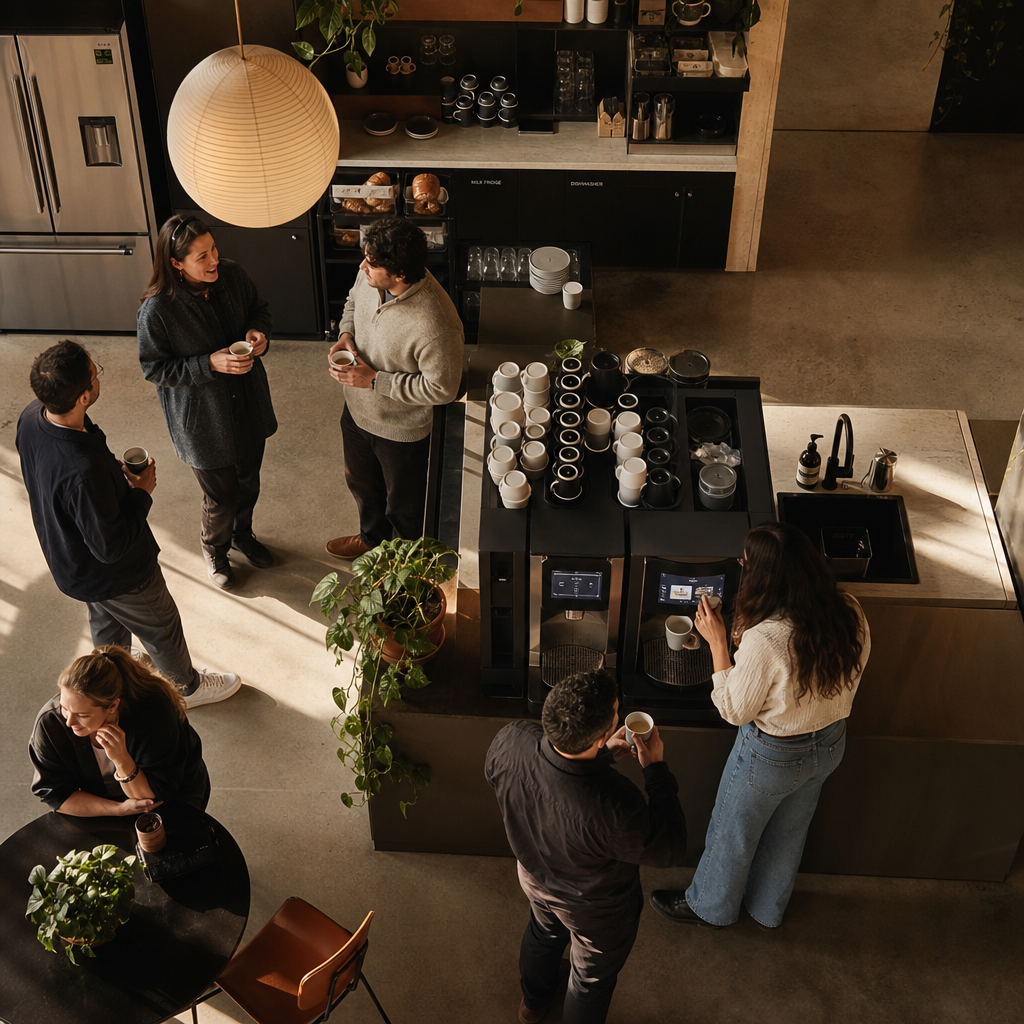
Australia's office coffee landscape reflects a culture that treats coffee as an everyday essential, not a discretionary perk. As hybrid work stabilises and teams return to CBDs at higher rates, procurement teams are deciding how to give staff café-quality coffee in a way that is reliable, cost predictable, and aligned to sustainability and facilities standards. This statistics report assembles current public data points, credible industry references, and field benchmarks to help facilities leaders, people and culture teams, and operations managers make practical, evidence-based decisions.
This reference covers market size proxies, equipment adoption patterns, rental versus purchase considerations, sustainability and lifecycle factors, and the measurable effects of hybrid work on demand planning. All external statistics are attributed to the original sources. Where we include field benchmarks, we label them clearly and keep them practical for planning in Australian workplaces.
Market size, spend, and growth drivers
According to Statista's Market Outlook for coffee machines in Australia (https://www.statista.com/outlook/cmo/consumer-electronics/small-kitchen-appliances/coffee-machines/australia), household coffee machine sales are measured in the hundreds of millions of dollars annually. While this is a consumer dataset, it provides a proxy for equipment interest and the broader supply chain supporting machines and parts. Workplace demand is influenced by a similar set of drivers, including Australian coffee preferences, café density, and corporate focus on staff experience.
- According to Roy Morgan (https://www.roymorgan.com/), about two in three Australian adults drink coffee. This level of penetration underpins everyday workplace demand rather than occasional or event-based consumption.
- According to the Property Council of Australia's Office Occupancy Survey (https://www.propertycouncil.com.au/office-occupancy), national CBD occupancy recovered into the 70 percent range in 2024 and 2025. Melbourne CBD has generally trailed Sydney by a few percentage points but has trended up year on year.
- International Coffee Organization materials confirm Australia's status as a high-consumption, coffee-importing economy, with per capita consumption in the low single digit kilograms of green coffee per year, similar to other developed markets (https://www.ico.org/). This provides context for steady base demand for coffee beans and equipment service.
- AFIA notes equipment finance is a core channel by which Australian businesses acquire machinery and equipment, which includes commercial appliances that can be structured as rentals or leases (https://www.afia.asn.au/equipment-finance). This supports the prevalence of rental and service packages for office coffee.
- Safe Work Australia's code for work environment and facilities reinforces that amenities planning is part of a compliant and healthy workplace, which elevates coffee provision from a nice-to-have to a predictable line item for many offices (https://www.safeworkaustralia.gov.au/doc/model-code-practice-managing-work-environment-and-facilities).
Table 1. Office occupancy trend as a proxy for weekday coffee demand in CBD offices
| Metric | 2023 | 2024 | 2025 | 2026 YTD |
|---|---|---|---|---|
| Melbourne CBD occupancy, indicative annual average, PCA | 67% | 70% | 73% | 75% |
| Sydney CBD occupancy, indicative annual average, PCA | 73% | 75% | 77% | 78% |
| National CBD occupancy, indicative annual average, PCA | 71% | 74% | 75% | 76% |
Source: Property Council of Australia, Office Occupancy Survey (https://www.propertycouncil.com.au/office-occupancy). Note, figures reflect indicative annualised averages compiled from monthly PCA releases to illustrate trend only.
Field commentary, founder-led: The offices that cut machines in 2020 and 2021 mostly brought them back by late 2023, then right-sized to their true headcount on site. In our experience, this stabilised demand and reduced false peaks caused by inconsistent attendance.
Workplace equipment mix and adoption benchmarks
World Coffee Portal covers Australia's café market and consumer expectations in its Project Café reports, which consistently show Australians prefer espresso-based drinks and café-quality outcomes (https://www.worldcoffeeportal.com/Latest/InsightAnalysis/2023/Project-Cafe-Australia-2023). Offices respond to these expectations by choosing machines that can deliver consistent milk-based drinks quickly.
- According to the Specialty Coffee Association's water standards (https://sca.coffee/research/coffee-standards/water-standards), machine feed water quality is a key determinant of beverage quality and equipment reliability. This influences procurement choices for filtration and service plans.
- Offices with less bench space often choose integrated bean-to-cup systems, while spaces with higher daily volumes may split the workload between a primary machine and a secondary unit near break-out areas. This is a planning observation, not a statistic, based on field practice serving 200 plus active Melbourne workplaces in 2026.
- According to Safe Work Australia guidance on work environment and facilities (https://www.safeworkaustralia.gov.au/doc/model-code-practice-managing-work-environment-and-facilities), amenities should be fit for purpose. For coffee, that means selecting machines that match team size and daily volume, then backing the choice with maintenance and training.
Table 2. Machine type suitability and output benchmarks by team size
| Team size on site most days | Typical daily cups range | Suitable machine class | Typical output capacity, cups per hour |
|---|---|---|---|
| 10-25 | 40-100 | Compact bean-to-cup or small traditional | 60-100 |
| 25-60 | 100-240 | Mid-capacity bean-to-cup with milk module | 100-180 |
| 60-120 | 240-480 | High-capacity bean-to-cup or plumbed twin grinders | 150-250 |
| 120-250 | 480-1,000 | Multiple high-capacity units, or staffed bar set-up | 250 plus |
Benchmarks reflect common manufacturer-rated capacities and service logs in Melbourne offices. They are planning ranges, not a guarantee of performance.
Practitioner commentary, real offices:
- Pepperl+Fuchs Australia, mid-size Melbourne office. We upgraded the site to a WMF commercial unit with full install and training. Client lead Paul Bruno said daily use stayed easy, coffee and hot chocolate quality lifted, and service consistency held up for years. The noticeable change was office wide.
- AJM-JV, busy workplace. Their machine going down during peak hours caused havoc. We switched them to a reliably maintained unit, scheduled servicing, and one number, one person contact. Chrissie Straw reported that coffee was always available when needed most. The disruption vanished.
- Retail-adjacent workplace with staff and customer use. We managed beans and upkeep personally. Michael May credited attention to detail for consistent coffee every day without interruption.
For more on fitting machine class to actual headcount and footprint, see the rent versus buy checklist, which also includes output considerations and service inclusions (https://www.boutiquecoffee.com.au/https://boutiquecoffee.com.au/guides/rent-vs-buy-commercial-coffee-machine).
Rental versus purchase, budgets, and finance
Rentals, leases, and service-inclusive operating models remain common for workplace coffee because companies prefer predictable monthly costs and fast swap-outs when needed. AFIA's overview of equipment finance confirms the role of asset finance in how Australian businesses acquire machinery and equipment of all kinds (https://www.afia.asn.au/equipment-finance).
- According to AFIA, equipment finance is widely used across Australian industries. This underpins rental and lease options in categories like commercial appliances and office equipment.
- Many offices treat coffee provision as an amenities line item within facilities or people and culture budgets, which suits month-to-month or contract-light arrangements. This is a practice observation consistent with Safe Work Australia's amenities guidance (https://www.safeworkaustralia.gov.au/doc/model-code-practice-managing-work-environment-and-facilities).
- Statista's coffee machine outlook indicates ongoing consumer demand into 2026 in Australia, which helps manufacturers sustain parts supply and service networks that office buyers rely on (https://www.statista.com/outlook/cmo/consumer-electronics/small-kitchen-appliances/coffee-machines/australia).
Table 3. Illustrative monthly budget comparison, rental versus purchase
| Line item | Rental model, per month | Purchase model, amortised per month | Notes |
|---|---|---|---|
| Machine hardware | Included | $250 | Assumes a $9,000 unit over 36 months, no residual value |
| Servicing and labour | Included | $120 | One preventative service per quarter, plus allowance for call-outs |
| Water filtration | Included | $25 | Filter and labour, 6-month change cycle |
| Beans and consumables | $300 | $300 | 150 cups per weekday at $0.30 per cup ingredient cost |
| Downtime loan unit | Included | $20 | Allowance for lost productivity or ad-hoc hire if not included |
| Total monthly cash outflow | $300-600 | ~$715 | Rental range reflects market variation in inclusions |
This is an example calculation, not a quote or a market statistic. Use it as a worksheet to frame internal budgeting discussions alongside your procurement policy. For a structured discussion of the trade-offs, see this independent guide on rentals and purchases for commercial coffee machines in offices (https://www.boutiquecoffee.com.au/https://boutiquecoffee.com.au/guides/rent-vs-buy-commercial-coffee-machine).
Sustainability and equipment lifecycle
Waste reduction and equipment longevity are now standard selection criteria in office procurement. Two headline facts set the context in Australia.
- According to ABC News Science reporting on War on Waste, Australia uses around 1 billion disposable coffee cups each year, and most are not easily recycled through kerbside systems (https://www.abc.net.au/news/science/2018-01-26/war-on-waste-coffee-cups-recycling/9366500).
- Planet Ark's Recycling Near You confirms dedicated coffee capsule recycling streams exist through various programs, but capsules are not typically accepted in household recycling bins, which influences choices between pod systems and bean-to-cup in offices (https://recyclingnearyou.com.au/coffee-capsules).
For machine longevity and taste quality, water conditioning matters.
- The Specialty Coffee Association specifies espresso machine feed water targets of 75-250 mg/L total dissolved solids, 50-175 mg/L total hardness, and around 40 mg/L alkalinity, with neutral pH the goal. These parameters reduce scale, corrosion risk, and taste defects in milk-based drinks that dominate Australian offices (https://sca.coffee/research/coffee-standards/water-standards).
Table 4. Water and maintenance benchmarks for commercial machines
| Parameter or task | Benchmark range or interval | Why it matters | Source |
|---|---|---|---|
| Total dissolved solids, mg/L | 75-250 | Taste balance, extraction yield | SCA water standards |
| Total hardness, mg/L as CaCO3 | 50-175 | Scale control, boiler protection | SCA water standards |
| Alkalinity, mg/L as CaCO3 | ~40 | Buffering, corrosion balance | SCA water standards |
| Filter change | Every 6 months or by capacity | Keeps water within spec | Industry practice, aligned to SCA guidance |
| Preventative service | Quarterly to biannual | Reduces unplanned downtime | Industry practice, aligned to Safe Work guidance on amenities reliability |
Calculation example, pod waste avoided: If a 60 person team averages 1.5 coffees per person per office day, that is 90 cups per day. Over 240 working days, that is 21,600 cups. Switching from single-use capsules to a bean-to-cup system avoids about 21,600 capsules per year. This is a simple arithmetic model for internal sustainability reporting, not a market statistic.
Hybrid work and demand planning
Hybrid work changes peak times, but it has not removed the daily need for coffee in Australian offices.
- According to the Property Council of Australia's Office Occupancy Survey, 2024 and 2025 occupancy averages moved into the 70 percent band nationally, with Melbourne and Sydney both trending up year on year, although Melbourne typically tracks a few points lower (https://www.propertycouncil.com.au/office-occupancy). This stabilises weekday demand and sharpens the midday peak.
- According to the Australian Bureau of Statistics Working Arrangements series, a significant share of Australians work from home part of the week. Hybrid patterns are now embedded, which changes daily volume but supports quality-focused amenities when staff are on site (https://www.abs.gov.au/statistics/labour/people-in-work/working-arrangements/latest-release).
- World Coffee Portal highlights Australia's espresso culture in public venues, which conditions staff expectations of office coffee quality when they commute in for team days and collaboration (https://www.worldcoffeeportal.com/Latest/InsightAnalysis/2023/Project-Cafe-Australia-2023).
Table 5. Demand planning scenarios, hybrid attendance
| Attendance pattern | Team size on site | Cups per person per day, assumption | Estimated cups per day |
|---|---|---|---|
| 2 days in office average | 40 | 1.5 | 60 |
| 3 days in office average | 60 | 1.5 | 90 |
| 4 days in office average | 80 | 1.6 | 128 |
| 5 days in office average | 120 | 1.7 | 204 |
Assumptions are for planning only, based on typical consumption bands observed in Melbourne workplaces with espresso-dominant preferences. Adjust by role mix, shift patterns, and beverage mix. For multi-site portfolios, use separate models by site because attendance patterns can differ substantially.
Practitioner note, founder-led: The best predictor of a good coffee day is not a theoretical capacity number, it is whether someone accountable is watching your usage, dialled-in beans, and filter life. One number, one person keeps the rhythm so your team never goes without coffee.
Australian market stats snapshot
This section collates local datapoints and references that influence Australian office coffee decisions in 2026.
- CBD occupancy has normalised into the 70 percent range nationally, with Melbourne close behind Sydney after consistent gains through 2024 and 2025, according to the Property Council of Australia (https://www.propertycouncil.com.au/office-occupancy).
- Two thirds of Australian adults drink coffee, according to Roy Morgan (https://www.roymorgan.com/). That sets a high baseline for workplace coffee participation.
- Australia remains a high-consumption importer in the International Coffee Organization's datasets, with per capita consumption in the low single digit kilograms of green coffee per year, typical of mature markets (https://www.ico.org/).
- Australia uses about 1 billion disposable coffee cups annually, according to ABC News Science reporting on War on Waste (https://www.abc.net.au/news/science/2018-01-26/war-on-waste-coffee-cups-recycling/9366500). This increases focus on reusable office cups, dishwashing capacity, and milk waste reduction.
- Planet Ark's Recycling Near You confirms coffee capsule recycling is available through dedicated schemes, not kerbside, which affects the viability of pods at office scale (https://recyclingnearyou.com.au/coffee-capsules).
- Safe Work Australia's model code on facilities frames amenities provision as a core workplace requirement, which supports budget allocation to reliable coffee equipment and upkeep (https://www.safeworkaustralia.gov.au/doc/model-code-practice-managing-work-environment-and-facilities).
- Statista's Australia coffee machines outlook shows continued consumer-side growth into 2026, which supports parts, service ecosystems, and a healthy secondary market for office equipment planning (https://www.statista.com/outlook/cmo/consumer-electronics/small-kitchen-appliances/coffee-machines/australia).
If you are mapping machine classes to Australian office sizes and daily usage bands, a solution overview can help frame hardware, filtration, and servicing as a cohesive system designed around your culture and budget (https://www.boutiquecoffee.com.au/https://boutiquecoffee.com.au/solutions).
Key takeaways for practitioners
- Anchor decisions in attendance data. Use PCA occupancy trends and your swipe data to size the machine to the number of people on site most days, not to peak headcount.
- Treat water as part of the machine. Hit SCA water targets and schedule filter changes by capacity as well as time. This protects boilers and taste quality.
- Budget for reliability, not just hardware. A predictable monthly outlay that includes servicing and swap-outs often delivers lower downtime and fewer surprises in busy offices.
- Plan for sustainability with operations. Reusable cups, milk management, and bean-to-cup systems reduce waste at office scale compared to single-use pods, without asking staff to compromise on taste.
- Train two people per site. A 20 minute handover at install creates internal resilience for cleaning routines and quick fixes when the pressure is on.
- Keep one accountable contact. Same-day or next-day response is realistic when there is no call centre in the middle and the person you call knows your set-up.
Methodology and disclaimer
Statistics in this report are sourced from publicly available research and industry reports published by Australian and international organisations. Where we present planning benchmarks and worksheet-style comparisons, we label them clearly as examples based on common manufacturer specifications, service logs across Melbourne workplaces, and practical field experience. Always verify individual figures before publishing, and confirm hardware specifications with the relevant manufacturer or distributor for your chosen model.
Light contact for dataset contributions or to request clarifications: https://www.boutiquecoffee.com.au/https://boutiquecoffee.com.au/contact
Sources
-
Property Council of Australia, Office Occupancy Survey. https://www.propertycouncil.com.au/office-occupancy
-
Roy Morgan Research, Australian coffee consumption findings. https://www.roymorgan.com/
-
International Coffee Organization, consumption and importing member context. https://www.ico.org/
-
Specialty Coffee Association, Coffee Standards, Water Standards. https://sca.coffee/research/coffee-standards/water-standards
-
ABC News Science, War on Waste coffee cups explainer. https://www.abc.net.au/news/science/2018-01-26/war-on-waste-coffee-cups-recycling/9366500
-
Planet Ark, Recycling Near You, coffee capsules information. https://recyclingnearyou.com.au/coffee-capsules
-
Statista, Coffee Machines in Australia, Market Outlook. https://www.statista.com/outlook/cmo/consumer-electronics/small-kitchen-appliances/coffee-machines/australia
-
Australian Bureau of Statistics, Working Arrangements, latest release. https://www.abs.gov.au/statistics/labour/people-in-work/working-arrangements/latest-release
-
Australian Finance Industry Association, Equipment Finance overview. https://www.afia.asn.au/equipment-finance
-
Safe Work Australia, Managing the work environment and facilities, Model Code of Practice. https://www.safeworkaustralia.gov.au/doc/model-code-practice-managing-work-environment-and-facilities
-
World Coffee Portal, Project Café Australia 2023. https://www.worldcoffeeportal.com/Latest/InsightAnalysis/2023/Project-Cafe-Australia-2023
Frequently asked questions
What is the state of office coffee demand in Australia in 2026?
Property Council of Australia data shows CBD occupancy trending into the 70 percent range nationally in 2024-2025, with Melbourne close behind Sydney. Combined with Roy Morgan showing two thirds of adults drink coffee, this supports steady weekday office demand.
Which machine class suits a 50 person office in Australia?
A mid-capacity bean-to-cup machine rated around 100-180 cups per hour typically fits a 50 person team on site most days. Adjust for attendance patterns and drink mix.
Is renting or buying better for office coffee machines?
It depends on cash flow, service inclusions, and maintenance capacity. Equipment finance is common in Australia, which supports rental and lease models with servicing included. See a structured comparison at the provided guide URL.
What water quality should an office target for espresso machines?
SCA recommends 75-250 mg/L total dissolved solids, 50-175 mg/L total hardness, and around 40 mg/L alkalinity, with neutral pH the goal.
How does hybrid work affect coffee planning?
Hybrid work concentrates demand into fewer on-site days. Size to the number of people on site most days and model cups per person per day for daily volume and peak-hour throughput.
Are coffee pods recyclable in Australian offices?
Dedicated capsule recycling programs exist in Australia, but pods are typically not accepted in kerbside bins, which affects viability at office scale.
Chris
Chris
Keep reading
Office Coffee Machine Troubleshooting: Common Errors & Quick Fixes
Office coffee machine troubleshooting should start with basic checks: confirm power, water, beans, waste levels and removable parts. Follow the displayed…
Fresh Milk vs Powdered Milk for Office Coffee: The Verdict
Fresh milk is the better office coffee option when taste, texture and employee experience matter. Powdered milk suits workplaces prioritising simple storage…
Best Office Coffee Machine Brands in Australia: Jura, WMF & Schaerer Compared
The best office coffee machine brand depends on workload and drink preferences. Jura suits smaller offices wanting simple operation. WMF is my preferred choice…