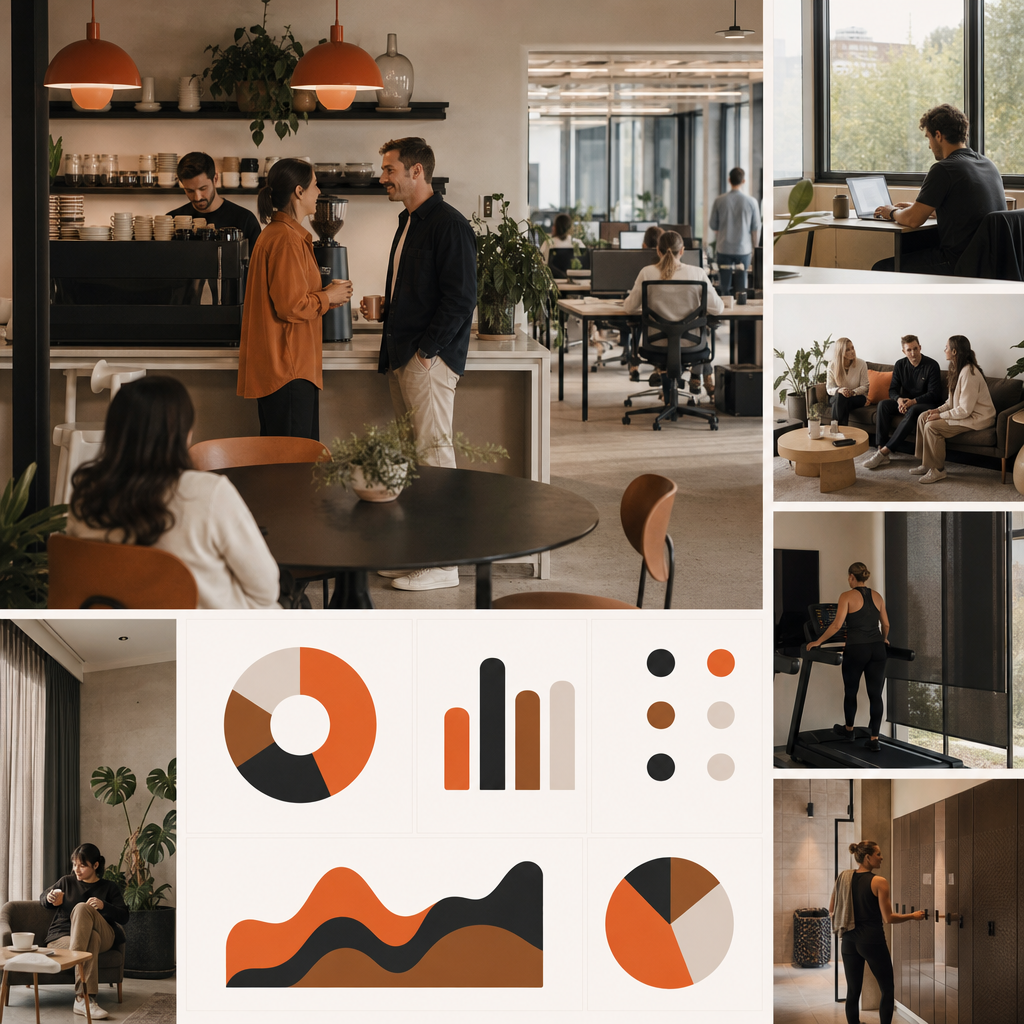
Key Statistics Summary
- According to the Australian Bureau of Statistics (ABS), 36% of employed Australians usually worked from home in August 2024.
- According to the ABS (More people working from home than ever before), approximately 2.5 million people worked from home on Census day in 2021, compared with 503,581 in 2016.
- According to Gallup's State of the Global Workplace 2025, 21% of employees globally were engaged at work during 2024.
- According to the same Gallup report, global manager engagement fell from 30% to 27% during 2024, while individual-contributor engagement remained at 18%.
- According to the ABS National Study of Mental Health and Wellbeing, 21.5% of Australians aged 16-85 experienced a mental disorder during the previous 12 months.
- According to the World Health Organization (WHO), an estimated 15% of working-age adults had a mental disorder in 2019, while depression and anxiety cause approximately 12 billion lost working days globally each year.
- According to the Workplace Gender Equality Agency's Gender Equality Scorecard, 68% of reporting Australian employers offered paid parental leave in the 2023-24 reporting period.
- According to Roy Morgan (Coffee the hot beverage of choice for Australians), 11.5 million Australians drank coffee in an average week when its national beverage findings were released in 2018.
Headline workplace perks statistics table
The following table brings together several of the most useful benchmarks. Reporting periods and populations differ, so the figures should not be treated as a single comparable dataset.
| Workplace metric | Reported figure | Population or geography | Source |
|---|---|---|---|
| Employed people who usually worked from home | 36% | Australia, August 2024 | ABS, Characteristics of Employment |
| Employees engaged at work | 21% | Global workforce, 2024 | Gallup, State of the Global Workplace 2025 |
| Managers engaged at work | 27% | Global managers, 2024 | Gallup, State of the Global Workplace 2025 |
| Australians experiencing a mental disorder in the previous 12 months | 21.5% | Australians aged 16-85, 2020-2022 | ABS, National Study of Mental Health and Wellbeing |
| Reporting employers offering paid parental leave | 68% | Relevant Australian employers, 2023-24 | WGEA, Gender Equality Scorecard |
| Australians drinking coffee in an average week | 11.5 million | Australians aged 14 and over, 2018 findings | Roy Morgan |
Introduction
Workplace perks statistics help employers distinguish between attractive extras and benefits that address material employee needs. Flexible work, paid leave, mental-health support, office design, food, coffee and opportunities for social contact can all affect how people experience work. They do not carry equal weight, however. A poorly designed benefit can have low participation even when its headline cost is high, while an everyday amenity can become valuable through accessibility, reliability and frequent use.
This 2026 reference report is intended for Australian workplace leaders, people and culture teams, facilities managers, property professionals, researchers and journalists. It combines the latest credible releases available at the time of preparation with older benchmark studies that remain relevant. The source year is shown for each figure because a report labelled for 2026 will often depend on surveys and administrative data collected earlier. No single statistic proves that a perk causes higher satisfaction or retention. The figures are best used to set priorities, identify questions for internal surveys and compare an organisation's experience with broader employee amenities trends in Australia.
Overview of Workplace Perks in Australia
A workplace perk is normally understood as an employer-provided benefit or amenity that sits alongside salary and statutory employment conditions. The category can include flexible work, paid parental leave above minimum requirements, additional leave, learning support, health programmes, end-of-trip facilities, meals, snacks and workplace coffee.
The distinction between a legal entitlement and a discretionary perk matters. According to the Fair Work Ombudsman, the National Employment Standards establish minimum employment entitlements covering matters such as maximum weekly hours, requests for flexible working arrangements, leave, public holidays, notice and redundancy. Employers should not label compliance with minimum standards as an employee perk.
Current office benefits data in Australia point to several practical conclusions:
- According to the ABS, 36% of employed people usually worked from home in August 2024. Flexible location is therefore a mainstream working arrangement rather than a benefit relevant only to a small remote-work population.
- According to the ABS 2021 Census analysis, approximately 2.5 million Australians worked from home on Census day in 2021. The equivalent 2016 Census count was 503,581, although pandemic restrictions make direct interpretation of the increase difficult.
- According to the WGEA Gender Equality Scorecard, 68% of relevant reporting employers offered paid parental leave in 2023-24. Paid parental leave has therefore become common among larger employers covered by WGEA reporting, but it is not universal.
- According to Gallup's State of the Global Workplace 2025, employee engagement declined globally during 2024. This indicates that the presence of benefits alone does not guarantee a positive employee experience.
- According to the Productivity Commission's Mental Health Inquiry Report, mental ill-health and suicide were estimated to cost Australia between $200 billion and $220 billion each year when the inquiry reported. The estimate extends beyond workplaces, but it shows why employee wellbeing cannot be treated as a minor benefits category.
Australian working-location benchmarks
The ABS figures below use different questions and collection methods. Census-day work location is not the same measure as usually working from home, so the table should be read as a set of reference points rather than a continuous trend series.
| Reference period | Measure | Australian result | Source |
|---|---|---|---|
| 2016 Census | People who worked from home on Census day | 503,581 | ABS Census analysis |
| 2021 Census | People who worked from home on Census day | Approximately 2.5 million | ABS Census analysis |
| August 2024 | Employed people who usually worked from home | 36% | ABS Characteristics of Employment |
These figures change how workplace amenities should be assessed. An office benefit available only at a central site will not have equal value for employees who spend substantial time elsewhere. Conversely, a workplace still needs to function well when people attend for collaboration, concentrated work, training or social contact. A practical benefits portfolio therefore considers access, frequency of use and the reason employees come to the workplace.
Benefits should also be assessed separately from organisational basics. Competitive pay, manageable workloads, safe work, capable management and predictable employment conditions are foundational. Amenities may complement those conditions, but they cannot compensate for a persistent failure in them.
Employee Satisfaction and Retention
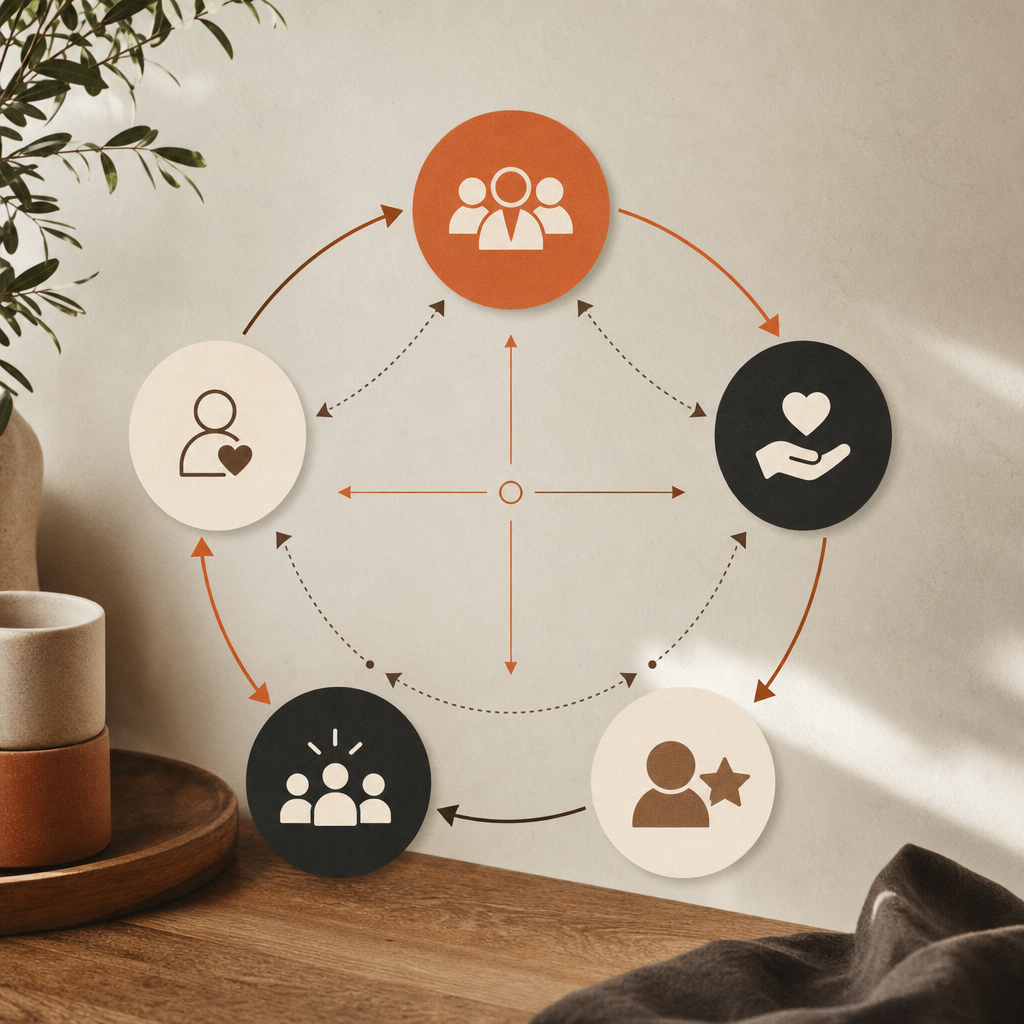
Workplace satisfaction statistics in Australia are often discussed alongside global engagement research. Engagement is not identical to satisfaction: engagement normally refers to an employee's involvement and enthusiasm, while satisfaction can reflect whether expectations about pay, management, flexibility, environment and other conditions are being met.
Gallup's international dataset supplies useful context because it applies a consistent measurement approach across countries:
- According to Gallup's State of the Global Workplace 2025, global employee engagement fell to 21% during 2024.
- According to the same Gallup report, manager engagement fell from 30% to 27% during 2024.
- According to Gallup, individual-contributor engagement was 18% during 2024.
- According to Gallup's workplace research on managers and engagement, managers account for at least 70% of the variance in employee engagement scores across business units.
The manager result is important when interpreting perks. A benefits programme can be well funded but inconsistently experienced if managers discourage flexible work, fail to communicate entitlements or make employees feel uncomfortable about using them. Access on paper is different from practical permission.
Retention analysis requires the same caution. Employees can leave because of pay, career development, management, working hours, location, health, caring responsibilities or job security. It is methodologically weak to credit a single amenity with a change in turnover unless an organisation has collected employee-level evidence and accounted for competing explanations.
A more defensible approach is to measure each benefit through several questions:
- Awareness: do eligible employees know the benefit exists?
- Access: can employees use it regardless of location, schedule, seniority or caring responsibilities?
- Participation: are eligible employees actually using it?
- Perceived value: would employees prefer the benefit to an alternative use of the same budget?
- Reliability: does the amenity work consistently when employees need it?
- Retention relevance: do departing and remaining employees identify it as a meaningful factor?
The WGEA parental-leave figure also illustrates why reporting needs detail. According to the WGEA Gender Equality Scorecard, 68% of reporting employers offered paid parental leave in 2023-24. The existence of a policy does not reveal its duration, pay level, eligibility rules, support for partners or the career experience of employees returning from leave. Practitioners need both the coverage statistic and the policy design.
Global engagement benchmark table
| Engagement measure | Earlier result | 2024 result | Source |
|---|---|---|---|
| Global employee engagement | 23% | 21% | Gallup, State of the Global Workplace 2025 |
| Global manager engagement | 30% | 27% | Gallup, State of the Global Workplace 2025 |
| Individual-contributor engagement | Not used here as a trend figure | 18% | Gallup, State of the Global Workplace 2025 |
The fall in engagement should not be interpreted as evidence that perks have no value. It does show that amenities operate within a wider system. Management quality, workload, role clarity and recognition remain central to the employee experience.
Office Environment and Design Trends
The growth of hybrid work has changed the question asked of office design. The issue is no longer simply how many desks fit into a floor plan. Employers also need to understand which activities employees expect to perform on site and whether the setting supports those activities.
Relevant data points include:
- According to the ABS, 36% of employed Australians usually worked from home in August 2024. Office planning based solely on permanent daily attendance may therefore misrepresent how a substantial share of the workforce uses space.
- According to the ABS Census analysis, approximately 2.5 million people worked from home on Census day in 2021, compared with 503,581 on Census day in 2016.
- According to Gensler's Global Workplace Survey 2024, high-performing workplaces need to support a broader mix of work activities and employee experiences than conventional desk-focused offices. Gensler's research treats effectiveness, experience and choice as related but distinct design outcomes.
- According to Leesman's workplace experience research, workplace quality is best evaluated through the activities employees perform and the features that support them, rather than through the presence of amenities alone.
The design implications are practical. Quiet individual work requires different settings from confidential calls, project collaboration, learning and informal social contact. A single open-plan environment may create visual consistency without supporting all of these activities equally well.
Amenity placement also affects use. A kitchen, coffee point or breakout area can create unplanned interaction, but it can also introduce noise into concentration zones. End-of-trip facilities can support active commuting, but only if access, storage, showers and maintenance are adequate. Meeting rooms can support hybrid collaboration, but only if audio, displays, booking systems and room acoustics work reliably.
This is why amenity counts are a weak benchmark on their own. A workplace with numerous poorly maintained features may perform worse than a simpler workplace where the essentials are chosen on purpose and operate consistently. Facilities teams should measure utilisation, faults, employee feedback and accessibility instead of treating installation as the end of the project.
Hybrid work also creates equity questions. Employees who attend less frequently may receive less practical value from food, fitness and social amenities. Remote workers may place more value on equipment support, flexible scheduling or periodic team gatherings. Employee surveys should therefore segment results by work pattern rather than relying only on an organisation-wide average.
Health and Wellness Initiatives
Mental-health data provide the strongest case for treating workplace wellbeing as a risk and work-design issue, not merely a collection of optional wellness activities.
- According to the ABS National Study of Mental Health and Wellbeing, 42.9% of Australians aged 16-85 had experienced a mental disorder at some point in their lives.
- According to the same ABS study, 21.5% experienced a mental disorder during the previous 12 months.
- According to the ABS, 17.4% experienced an anxiety disorder during the previous 12 months.
- According to the WHO, an estimated 15% of working-age adults had a mental disorder in 2019.
- According to the WHO, depression and anxiety result in an estimated 12 billion lost working days globally each year.
- According to the Productivity Commission, mental ill-health and suicide were estimated to cost Australia between $200 billion and $220 billion annually at the time of its inquiry.
Mental-health and wellbeing benchmark table
| Measure | Reported figure | Reference population or period | Source |
|---|---|---|---|
| Lifetime experience of a mental disorder | 42.9% | Australians aged 16-85, study period 2020-2022 | ABS, National Study of Mental Health and Wellbeing |
| Mental disorder in the previous 12 months | 21.5% | Australians aged 16-85, study period 2020-2022 | ABS, National Study of Mental Health and Wellbeing |
| Anxiety disorder in the previous 12 months | 17.4% | Australians aged 16-85, study period 2020-2022 | ABS, National Study of Mental Health and Wellbeing |
| Working-age adults estimated to have a mental disorder | 15% | Global estimate for 2019 | WHO, Mental health at work |
| Working days lost to depression and anxiety | 12 billion annually | Global estimate | WHO, Mental health at work |
Safe Work Australia distinguishes workplace psychological health and safety from general wellbeing. Its psychosocial hazards guidance identifies work-related factors such as high job demands, low job control, poor support, inadequate reward and recognition, remote or isolated work, bullying and harassment. This means an employer cannot rely on a wellness app, fruit delivery or awareness event while leaving harmful work conditions unaddressed.
The WHO makes a similar distinction. Its mental-health-at-work guidance recommends preventing work-related mental-health conditions, protecting and promoting mental health, and supporting workers who experience mental-health conditions. These areas involve job design, manager capability, reasonable adjustments and return-to-work support, not only individual resilience.
Physical amenities can still contribute to a healthier environment. Drinking water, suitable meal areas, ergonomic equipment, daylight access, movement options and end-of-trip facilities may remove friction from healthier behaviour. Their value should be evaluated through use and employee feedback, not assumed from availability.
Food and beverage policies also need to account for caffeine. According to Healthdirect Australia, healthy adults should consume no more than 400 mg of caffeine per day, while people who are pregnant or breastfeeding are advised to limit intake to 200 mg per day. Caffeine content varies between products and serving methods, so workplaces should provide water and caffeine-free choices alongside coffee and tea.
The Role of Food and Beverage Amenities
Food and beverage amenities are different from many annual benefits because employees may encounter them repeatedly during an ordinary working week. Their practical value depends on quality, dietary inclusion, availability, cleanliness, replenishment and whether they suit the way the workplace operates.
Australian coffee data provide useful context:
- According to Roy Morgan, 11.5 million Australians aged 14 and over drank coffee in an average week when the research findings were published in 2018.
- According to the same Roy Morgan research, 9.8 million Australians drank tea in an average week.
- According to Roy Morgan, 15.2 million Australians consumed at least one hot beverage in an average week.
- According to Healthdirect Australia, healthy adults are advised to keep daily caffeine intake at or below 400 mg.
- According to Healthdirect, the recommended caffeine limit during pregnancy or breastfeeding is 200 mg per day.
- According to Foodbank Australia's Hunger Report 2024, 3.4 million Australian households experienced food insecurity during the previous 12 months, including 2 million households experiencing severe food insecurity. Workplace food is not a substitute for adequate income or social support, but the figures reinforce the need to avoid assumptions about employees' access to food.
Food, beverage and caffeine benchmark table
| Measure | Reported figure | Population or guidance group | Source |
|---|---|---|---|
| People drinking coffee in an average week | 11.5 million | Australians aged 14 and over | Roy Morgan |
| People drinking tea in an average week | 9.8 million | Australians aged 14 and over | Roy Morgan |
| People consuming a hot beverage in an average week | 15.2 million | Australians aged 14 and over | Roy Morgan |
| Recommended maximum daily caffeine intake | 400 mg | Healthy adults | Healthdirect Australia |
| Recommended maximum daily caffeine intake | 200 mg | People who are pregnant or breastfeeding | Healthdirect Australia |
| Households experiencing food insecurity | 3.4 million | Australian households during the previous 12 months | Foodbank Hunger Report 2024 |
| Households experiencing severe food insecurity | 2 million | Australian households during the previous 12 months | Foodbank Hunger Report 2024 |
The Roy Morgan findings establish widespread hot-beverage consumption, but they do not prove that free coffee causes higher productivity or retention. Research about consumption preference should not be presented as causal workplace evidence.
The more defensible interpretation is that coffee and tea are familiar, frequently used amenities for a large Australian population. Employers can measure their local relevance by surveying drink preferences, monitoring consumption and faults, and checking whether options accommodate people who avoid caffeine, dairy or particular ingredients.
Reliability matters because a frequently used amenity creates a repeated experience. In the author's direct work with a busy Melbourne workplace, machine failures during peak office hours caused noticeable disruption. Regular maintenance and a direct service contact removed the recurring interruption. This is an operational observation, not a controlled productivity study, but it illustrates why uptime belongs in amenity evaluation.
Boutique Coffee's own operating data provide a separate practitioner reference point. As of 2026, the business reported more than 200 active Melbourne workplace rental clients, an average active-client relationship exceeding 5 years and a typical service-call response time of 24 hours. These are Boutique Coffee's own business figures and should not be generalised as Australian industry averages.
The practical lesson is that a food or beverage amenity should be judged as a complete service. Product quality, equipment fit, replenishment, hygiene, training and fault response all affect the employee experience. In operational terms, one number, one person can be more useful than a complex escalation path, particularly when a simple issue can be diagnosed quickly by someone familiar with the site.
Australian Market Statistics
Australian workplace-perk planning needs local evidence because employment law, commuting patterns, office geography, public health settings and employee expectations differ from overseas markets.
The strongest Australian benchmarks in this report are:
- According to the ABS, 36% of employed Australians usually worked from home in August 2024.
- According to the ABS Census analysis, approximately 2.5 million Australians worked from home on Census day in 2021, compared with 503,581 in 2016.
- According to the ABS National Study of Mental Health and Wellbeing, 21.5% of Australians aged 16-85 experienced a mental disorder during the previous 12 months.
- According to the same ABS study, 17.4% experienced an anxiety disorder during the previous 12 months.
- According to the WGEA Gender Equality Scorecard, 68% of reporting employers offered paid parental leave during 2023-24.
- According to Roy Morgan, 11.5 million Australians aged 14 and over drank coffee in an average week in its published hot-beverage findings.
- According to Foodbank Australia, 3.4 million Australian households experienced food insecurity during the previous 12 months covered by its 2024 report.
- According to the Productivity Commission, the annual economic and social cost associated with mental ill-health and suicide was estimated at between $200 billion and $220 billion when its inquiry reported.
Australian benchmark summary
| Category | Australian benchmark | Source year or period | Source |
|---|---|---|---|
| Usually working from home | 36% | August 2024 | ABS |
| Mental disorder in previous 12 months | 21.5% | Study period 2020-2022 | ABS |
| Anxiety disorder in previous 12 months | 17.4% | Study period 2020-2022 | ABS |
| Reporting employers offering paid parental leave | 68% | 2023-24 | WGEA |
| People drinking coffee in an average week | 11.5 million | Findings published in 2018 | Roy Morgan |
| Households experiencing food insecurity | 3.4 million | Foodbank Hunger Report 2024 | Foodbank Australia |
IBISWorld Australia maintains market research covering Australian human resources, office property, catering and coffee-related industries. Its reports can provide additional market sizing and business counts, but figures behind subscription access have not been reproduced here because this article could not independently verify every current value. See IBISWorld Australia for the publisher's current catalogue.
The Australian Competition and Consumer Commission also provides guidance relevant to employer purchasing and supplier representations. According to the ACCC, businesses must not make false or misleading claims. Workplace decision-makers should therefore ask suppliers to substantiate claims about productivity, health outcomes, sustainability and employee retention rather than accepting unsupported marketing percentages.
Key Takeaways
- Separate essentials from extras. Fair pay, safe work, appropriate staffing, sound management and compliance with employment standards are foundational. Perks should complement these conditions rather than distract from deficiencies.
- Design for hybrid access. With the ABS reporting that 36% of employed Australians usually worked from home in August 2024, employers should check whether their benefits portfolio creates unnecessary gaps between office-based, hybrid and remote employees.
- Treat manager behaviour as part of benefits delivery. Gallup's engagement data show that managers have a major influence on how employees experience work. A policy has limited practical value if employees feel unable to use it.
- Address psychosocial hazards before adding surface-level wellness activities. Safe Work Australia guidance places work design, demands, support and harmful behaviour at the centre of psychological health and safety.
- Measure utilisation and reliability. For office amenities, installation is not a meaningful endpoint. Track use, faults, replenishment, complaints, accessibility and employee preference.
- Avoid unsupported causal claims. Coffee consumption data do not prove productivity gains, just as parental-leave availability does not by itself prove retention. Use internal surveys and workforce data to test local relationships.
- Offer genuine choice. Food and beverage programmes should include water, caffeine-free choices and options that account for dietary needs. Healthdirect's caffeine guidance is relevant when setting workplace defaults.
- Compare benefits by employee value, not novelty. An everyday amenity that works reliably may be valued more than an expensive benefit with low awareness or restricted access.
For additional publisher context, Boutique Coffee maintains an overview of workplace coffee solutions and a separate evidence discussion about office coffee, retention and productivity. Organisations that need to assess an actual workplace setup can review the stated free trial process or submit a site-specific question through the contact page.
Methodology and Disclaimer
This article was prepared as a statistics aggregation resource for 2026. It prioritises Australian Government bodies, international public-health organisations and established research publishers. Sources include the Australian Bureau of Statistics, Workplace Gender Equality Agency, Productivity Commission, Safe Work Australia, Fair Work Ombudsman, World Health Organization, Gallup, Foodbank Australia, Roy Morgan, Gensler and Leesman.
Statistics were retained under their original reporting periods. Older findings were not relabelled as 2026 data. For example, Roy Morgan's hot-beverage figures remain findings published in 2018, while ABS mental-health results retain their 2020-2022 study period. The current article year indicates publication context, not the collection year of every underlying dataset.
The datasets use different populations, definitions and methods. Census-day work location is not directly equivalent to usually working from home. Employee engagement is not identical to job satisfaction. The availability of paid parental leave does not reveal the generosity or accessibility of a policy. International figures should not automatically be treated as Australian estimates.
Statistics sourced from publicly available research and industry reports. Verify individual figures before publishing. Source pages, definitions and revisions should also be checked before using a statistic in organisational policy, investment decisions or media reporting.
Boutique Coffee's client counts, relationship length and service response time are identified as the author's own business data. They have not been presented as national market benchmarks or independent evidence of a causal relationship between coffee and employee outcomes.
Sources
- Australian Bureau of Statistics, Characteristics of Employment, Australia.
- Australian Bureau of Statistics, More people working from home than ever before.
- Australian Bureau of Statistics, National Study of Mental Health and Wellbeing.
- Workplace Gender Equality Agency, Australia's Gender Equality Scorecard.
- Gallup, State of the Global Workplace.
- Gallup, Why Great Managers Are So Rare.
- World Health Organization, Mental health at work.
- Productivity Commission, Mental Health Inquiry Report.
- Safe Work Australia, Psychosocial hazards.
- Fair Work Ombudsman, National Employment Standards.
- Roy Morgan, Coffee the hot beverage of choice for Australians.
- Healthdirect Australia, Caffeine.
- Foodbank Australia, Foodbank Hunger Report 2024.
- Gensler Research Institute, Global Workplace Survey 2024.
- Leesman, Workplace experience research.
- Australian Competition and Consumer Commission, False or misleading claims.
- IBISWorld Australia, Australian industry research catalogue.
Frequently asked questions
What are the most common workplace perks in Australia?
Common categories include flexible work, paid parental leave, additional leave, professional development, health support, end-of-trip facilities, food and workplace coffee. Availability varies by employer, occupation and location.
How many Australians work from home?
The Australian Bureau of Statistics reported that 36% of employed Australians usually worked from home in August 2024. This differs from Census-day work-location measures.
Do workplace perks improve employee retention?
Perks may contribute to the employee experience, but no single benefit should be assumed to cause retention. Pay, management, workload, flexibility, career opportunities and personal circumstances can also influence turnover.
Are wellness programmes enough to manage workplace mental health?
No. Safe Work Australia and the World Health Organization emphasise prevention, work design, psychosocial risk management, manager support and reasonable adjustments alongside individual wellbeing services.
Is workplace coffee linked to higher productivity?
Australian consumption research shows that coffee is widely consumed, but consumption figures do not prove that free workplace coffee causes higher productivity. Employers need internal evidence before making a causal claim.
How should employers measure the value of workplace amenities?
Employers can track awareness, eligibility, participation, employee preference, accessibility, reliability, faults and cost per use. Results should be segmented by work pattern and employee group where appropriate.
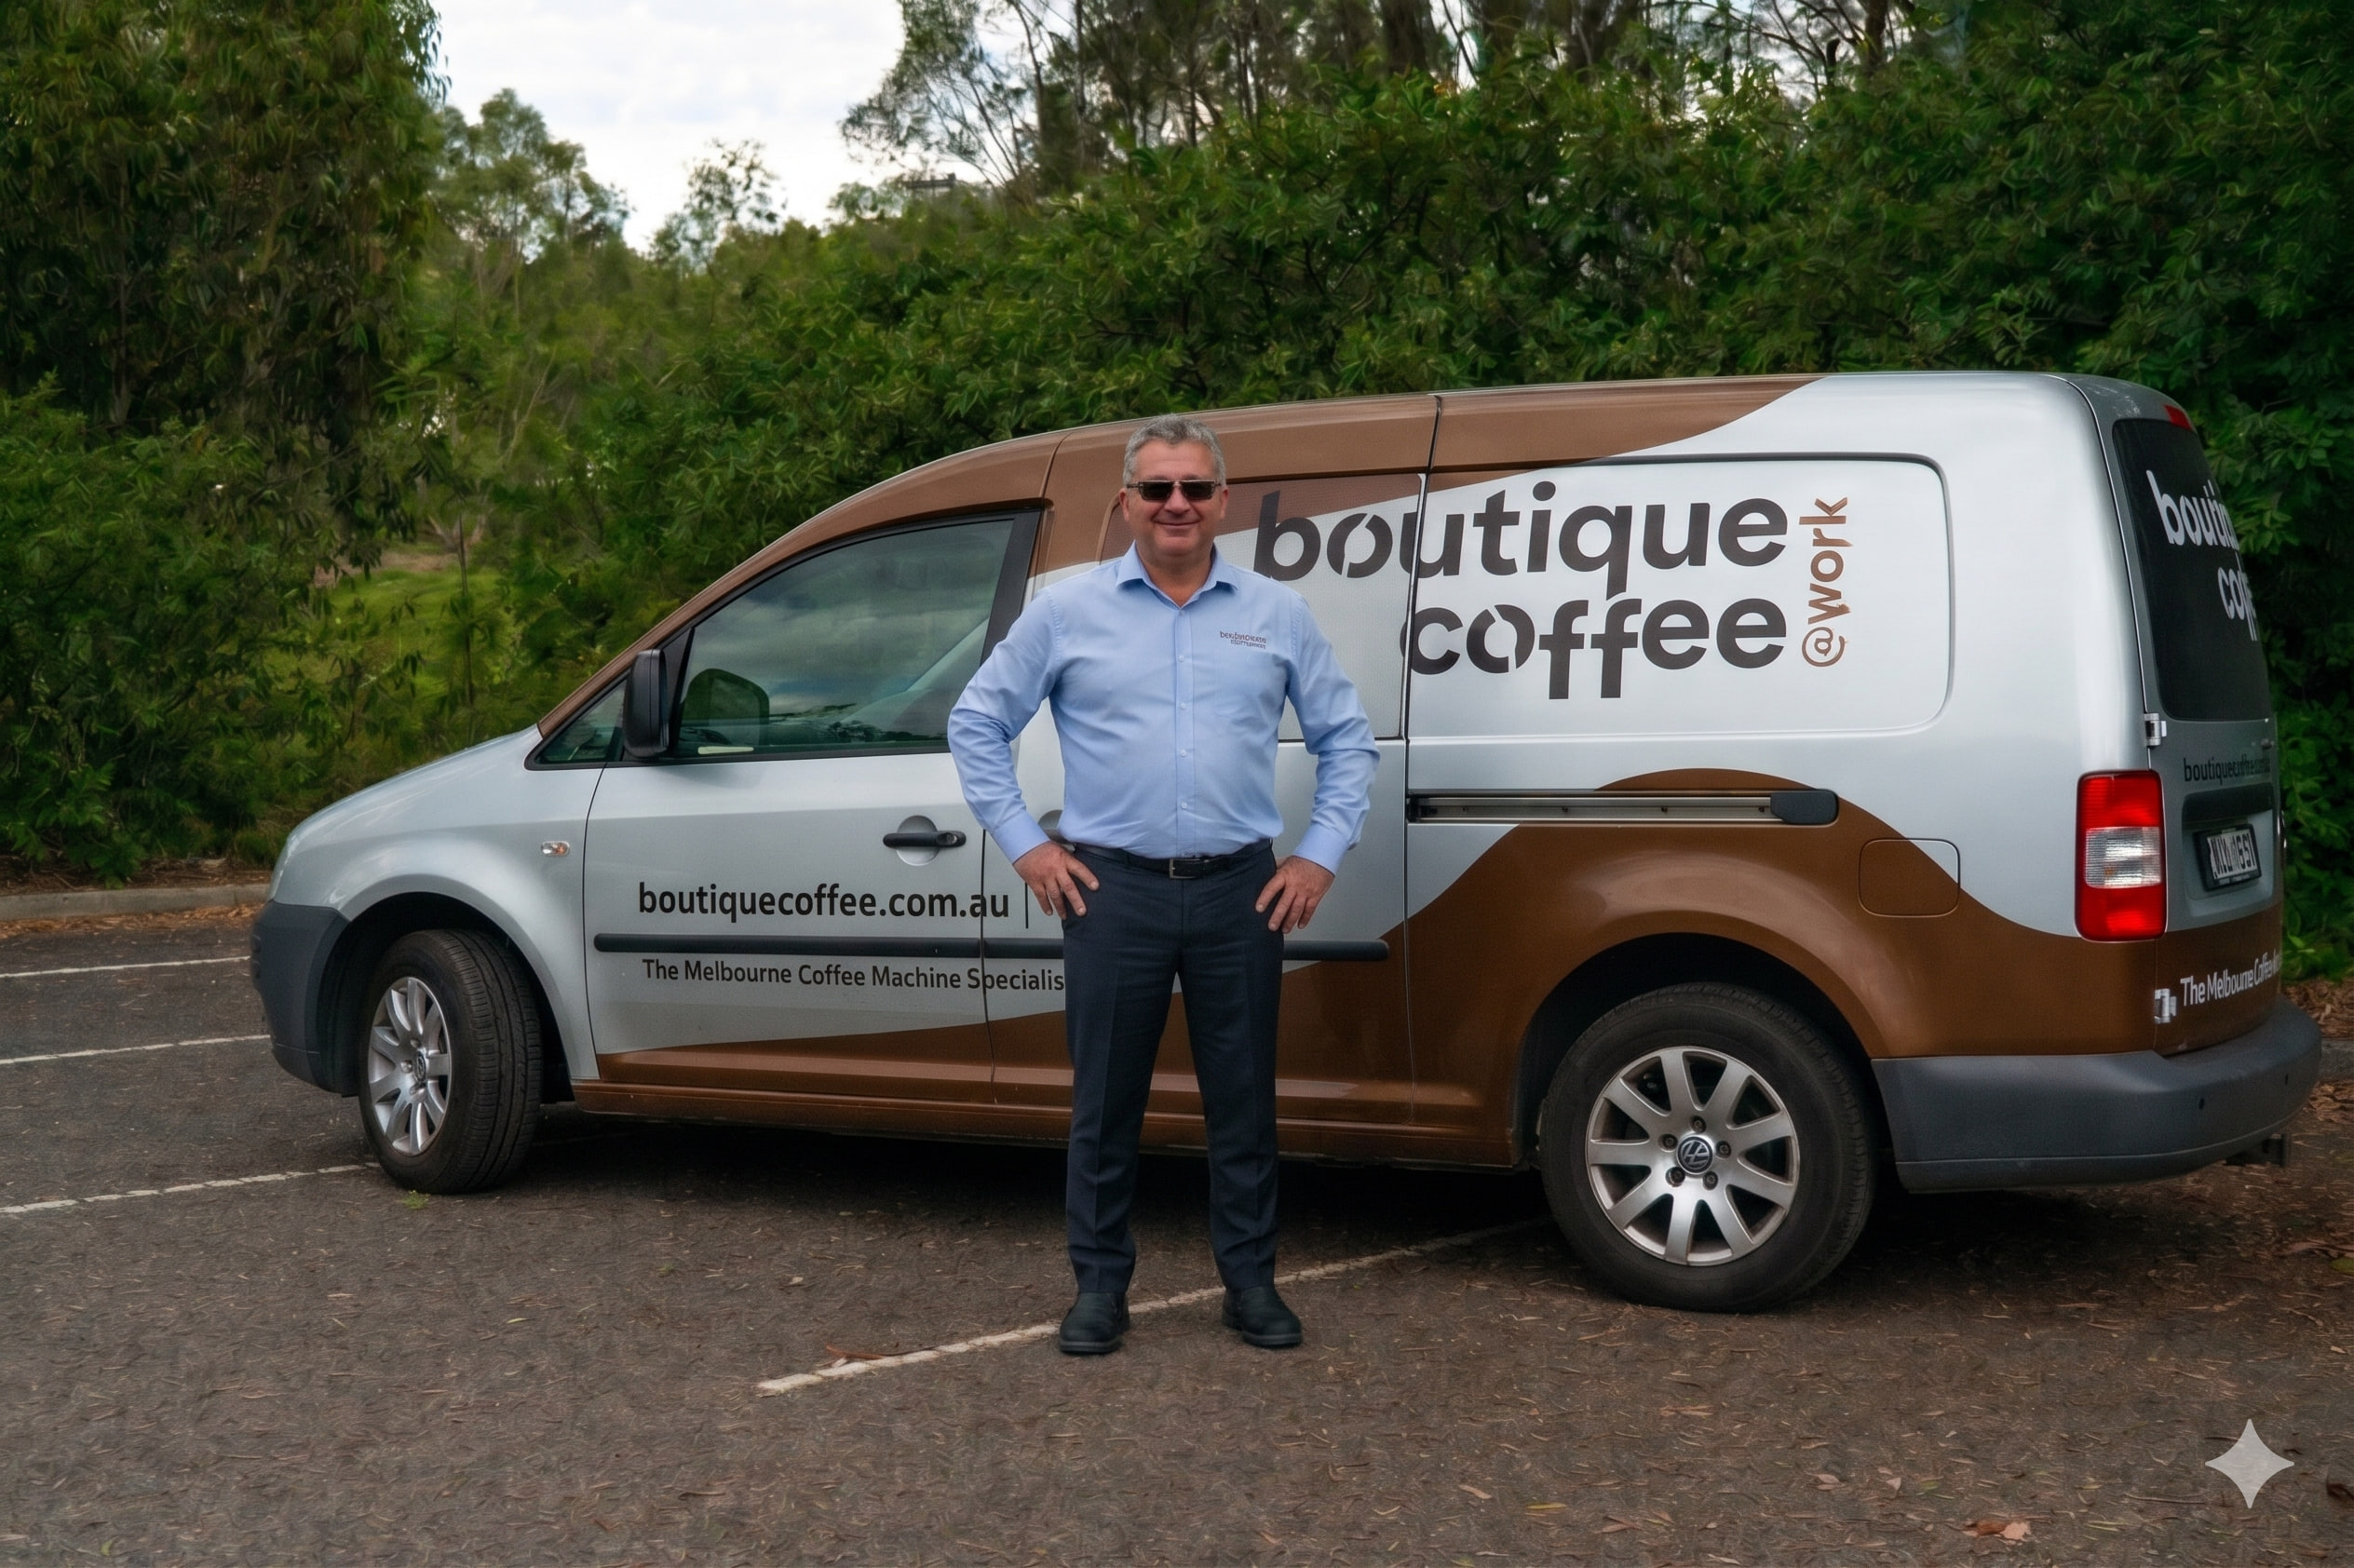
Chris
Chris
Keep reading
Plumbed vs Water Tank Office Coffee Machines: Installation, Costs & Which Suits Your Workplace
Introduction If you are deciding between a plumbed office coffee machine and a water tank model, you are really choosing between consistency at scale and…
Office Coffee Machine Hygiene: Cleaning Standards & Food Safety for Australian Workplaces
If your office coffee machine has never been professionally cleaned, you are not alone. Across Melbourne workplaces, I see the same pattern repeatedly: a…
Office Coffee vs Daily Cafe Runs: The True Cost Comparison for Australian Workplaces
If your team of 30 is walking to the cafe twice a day, you are not just spending money on coffee. You are spending money on time, on attention gaps, on the…